Batch Peak Analysis Using Theme
Perform batch processing of multiple spectra using peak analyzer theme
1. paMultiY iy:=[MultiplePeaks]Sheet1!(A,B:E) theme:="IntegratePeaks";
2. paMultiY iy:=[MultiplePeaks]Sheet1!(A,B:E) theme:="IntegratePeaks" number:=2 clear:=1;
3. paMultiY iy:=[MultiplePeaks]Sheet1!(A,B:E) theme:="myPeaksfit" initvalues:=1;
Please refer to the page for additional option switches when accessing the x-function from script
| Display Name |
Variable Name |
I/O and Type |
Default Value |
Description |
|---|---|---|---|---|
| Input | iy |
Input XYRange |
|
Specify the input datasets. Note that beginning with Origin 2020b, there is a shortened syntax that follows the form [Book]Sheet!(X,Y1:YN), X = the common X column and Y1:YN = a contiguous range of Y columns to the right of the X column. More complex strings from non-contiguous data of the form [Book]Sheet!((X,Y1:YN),(X,YM:YO)) are also possible. |
| Theme | theme |
Input string |
|
Specify the theme that used to perform peak analysis. |
| Result Sheet | append |
Input int |
|
The peak analysis on each dataset will generate a workbook. You can choose a worksheet in the workbook with this variable and the information in the worksheet will be appended to the Output Sheet.
Option list:
|
| Include Fit Statistics in Report | fitresult |
Input int |
|
Specify whether include the Fit statistics in the result report. It is invisible in GUI if append mode is by column. |
| Output Sheet | ow |
Output Worksheet |
|
Specify the worksheet for outputting the result of the peak analysis performed to each input dataset. |
| Delete Intermediate Result | remove |
Input int |
|
Specify whether to delete the intermediate analysis outputs that are generated by performing the peak analysis on the input datasets. |
| Dataset Identifier | dataid |
Input string |
|
Specify full range, long name, units or user-defined parameters of input data as the dataset name in the summary report. |
| Designation | desig |
Input string |
|
Specify the resource of Dataset Identifier, decide to get it from the X column or Y column of the range |
| Starting Row of Output Sheet | number |
Input int |
|
Specify the starting row of the Output worksheet from which the results are appended. |
| Clear Output Sheet on Start | clear |
Input int |
|
Specify whether to clear the Output Sheet before appending results to it. |
| Append Label Rows (1st File) | label |
Input int |
|
Specify whether to append label rows of the first Result Sheet into the Output Sheet. |
| Append by | mode |
Input int |
|
Specify the way to append the data to Output Sheet.
Option list:
|
| Sequentially Initialize Parameter Values | initvalues |
Input int |
|
When this option is selected, the peak information saved in theme will only be applied to 1st dataset in the batch processing. subsequent dataset will use peak initialization values form previous dataset's fitting result. |
| Script Before Each Process | beforescript |
Input string |
|
Scripts in this edit box will be executed before peak analysis performed on each one of the input datasets.
Note that: _rx refers to the range of i-th x dataset _ry refers to the range of i-th y dataset _skip determines if i-th file/dataset will be skipped |
| Script after Each Process | loopscript |
Input string |
|
The script in this edit box will be executed each time peak analysis is performed on one of the input datasets.
Note that: _i refers to the index of i-th file/dataset |
| Script at the End | endscript |
Input string |
|
The Scripts in this edit box will be executed after peak analysis has been performed on all of the input datasets. |
| Use Background Instance(s) to Process | instance |
Input int |
|
Run multiple Origin processes to increase processing speed. We suggest to set the value to be the number of logical cores of your computer minus 1 to reach the maximum benefit. That is, if the number of logical cores is 8, set the value to be 7
|
This X-Function performs peak fitting to multiple datasets with the same set of settings. The settings must be saved to a analysis theme file in advanced. Results perform to different datasets can be summarized in a summary worksheet.
The following example will first create an analysis theme and then show you how to use this X-Function to perform peak analysis on multiple datasets.
This example shows you how to create an analysis theme in the Peak Analyzer and then use the theme
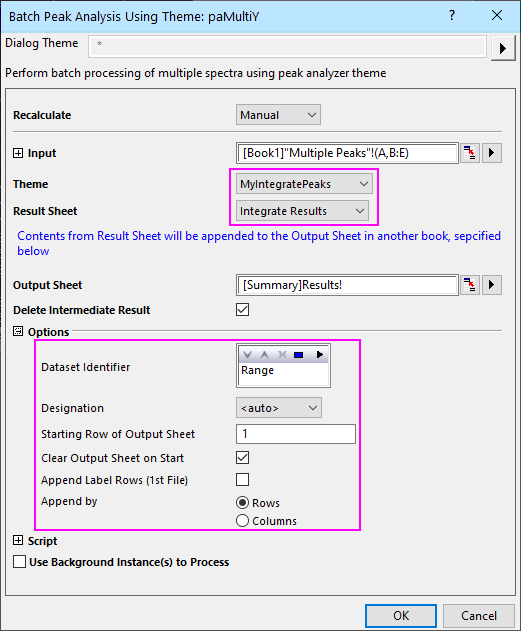
Select the Multiple Peaks worksheet and highlight all the Y columns. Then select Analysis: Peak and Baseline: Batch Peak Analysis using Theme to open the dialog. Then set the dialog as the following image shows. Click the OK button to perform the analysis.
X-Function:BatchProcess, blauto, fitpeaks, pa, pkFind, NLfitpeaks
Keywords:spectrum, summary report