![]() See more related video:Creating Intersecting Surfaces Plots from Worksheets and Setting Transparency
See more related video:Creating Intersecting Surfaces Plots from Worksheets and Setting Transparency
![]() See more related video:Creating Intersecting Surfaces Plots from Worksheets and Setting Transparency
See more related video:Creating Intersecting Surfaces Plots from Worksheets and Setting Transparency
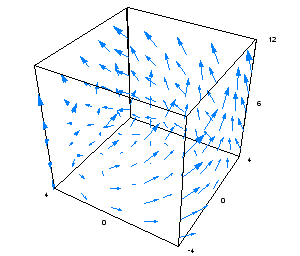
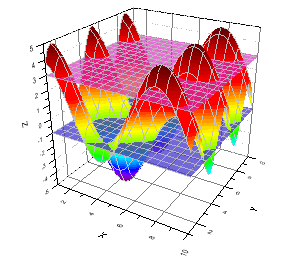
Three dimensional graphs have a wide variety of applications in science, engineering and finance. Origin includes a wide range of 3D graph types, including 3D Scatter, 3D Bars, and 3D Surfaces. Creating these graphs is quick and easy with Origin: you can simply select your data and click the desired plot button or menu command to create your graph. Once created, you can modify and manipulate the graph in many ways, including rotating, resizing, plotting the intersection of multiple surfaces, modifying axis label display, etc. You can rotate and resize 3D graphs graphically or by typing precise numbers into text boxes. You can generally modify the appearance of any graph element by double-clicking on it, opening a dialog box and editing settings. Here, we se three examples of 3D graphs:
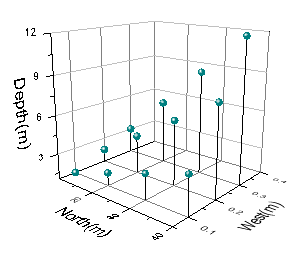
3D Scatter From Matrix with "In 3D Plane" Axis Titles and Tick Labels |
|
|
Origin supports OpenGL for all 3D graphs. Below is the minimum system requirements for Origin to plot OpenGL graphs, especially the video card and driver requirements:
Large Datasets, Additional Recommendations: For users who work with large datasets (e.g. import text files of 10MB in size, or greater), OriginLab makes the following additional recommendations.
|
Starting with version 2017, you can insert 2D text and drawing objects, plus tables, images, bubble scales, and OLE objects, into Origin's 3D openGL graphs. |
The graph types are listed below, along with the data formats that can be used to create each type. For the definition of a Virtual Matrix, see Creating 3D and Contour Graphs from a Virtual Matrix.
| Graph Type | XYZ Columns in Worksheet | XYY Columns in Worksheet | Matrix Window | Virtual Matrix in Worksheet |
|---|---|---|---|---|
|
Yes
(3D Ternary Colormap Surface requires XYZZ columns) |
No | Yes | Yes |
|
Yes | No | Yes | No |
|
Yes | No | No | No |
|
No | Yes | No | No |
|
No | No | Yes | Yes |
|
No | No | Yes | No |
| Note: A contour triangulation algorithm that plots raw X and Y data was implemented for Origin 2016. Previous versions performed some normalization of X and Y data before plotting. Thus, contour and 3D surface plots of XYZ worksheet data, created in version 2016 and higher, may differ from plots of the same data created in earlier versions. This change will be most noticeable if there are large scale range differences between X and Y values. See FAQ-822 for more information. |
To create a 3D graph from matrix or worksheet data, you select the data, and click the appropriate graph button on the 3D and Contour Graphs toolbar. Alternately, you select a graph from the Plot menu. To create a graph from a virtual matrix, you must click the graph button on the 3D and Contour Graphs toolbar to bring up a dialog that will help you specify the X,Y,Z data and create the graph. For more details about creating graphs from virtual matrices, please refer to Creating 3D and Contour Graphs from Virtual Matrices. We have introduced each 3D graph type in detail in Appendix 2 - Graph Types, you can refer to it for more details.
Customization of 3D graphs is mainly done in the Axis and the Plot Details dialog boxes. You can learn more about the Axis dialog, and learn how to customize graph axes in Graph Axes. For more on the Plot Details dialog box, refer to Customizing Your Graph.