22 GeoTIFF Importing and Processing
GeoTIFF-Importing-Processing
A GeoTIFF is a standard .tif or image file format that includes additional spatial (georeferencing) information embedded in the .tif file as tags. Starting from 2022b, you can easily handle the GeoTIFF files in Origin.
Import Geotiff
GIS, Import
Import as Images
- To import a GeoTIFF file:
Select File: New: Image: Image/Video menu to open the GeoTIFF as image in Origin.
- To import multiple GeoTIFF files:
Select File: New: Image: Multiple Image Files menu to open multiple GeoTIFF files as image in Origin.
Import as Matrix
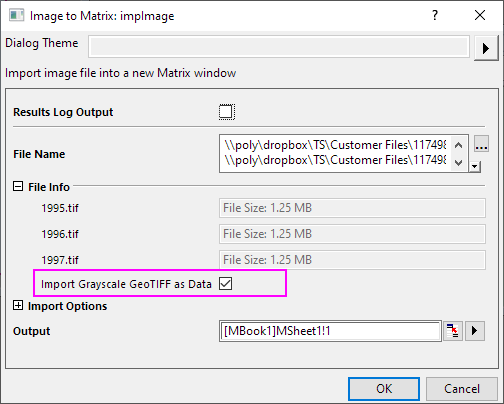
- Active a Matrix, select Data: Import from File: Image to Matrix menu and choose the imported files.
- In Image to Matrix dialog, check the Import Grayscale GeoTIFF as Data checkbox.
Export GeoTiFF
When exporting images or matrices to GeoTIFF, you should check the Export as Grayscale GeoTIFF check box. This adds GeoTIFF Options to these dialogs.
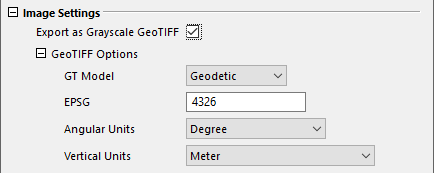
- Specify GT Model, EPSG, Angular Units and Vertical Units, as needed.
- Settings that are predefined in the GeoTIFF will be dimmed (grayed-out) and not editable.
Export Images as GeoTiFF
- Select File: Export Image menu to open the Export Image dialog (X-Function = cvExport).
- Check the Export as Grayscale GeoTIFF checkbox.
- You can custom GT Model, EPSG and Units option for GeoTIFF file.
| Note: If the image in the Origin is from a GeoTiFF file, when it export to GeoTiFF again the GT Model, EPSG and Units with default data.
|
Export Matrix as GeoTiFF
- Select File: Export: Image menu to open the Image dialog (X-Function = expImage).
- Check the Export as Grayscale GeoTIFF checkbox.
- You can custom GT Model, EPSG and Units option for GeoTIFF file.
Visualize and Processing
GIS, Process
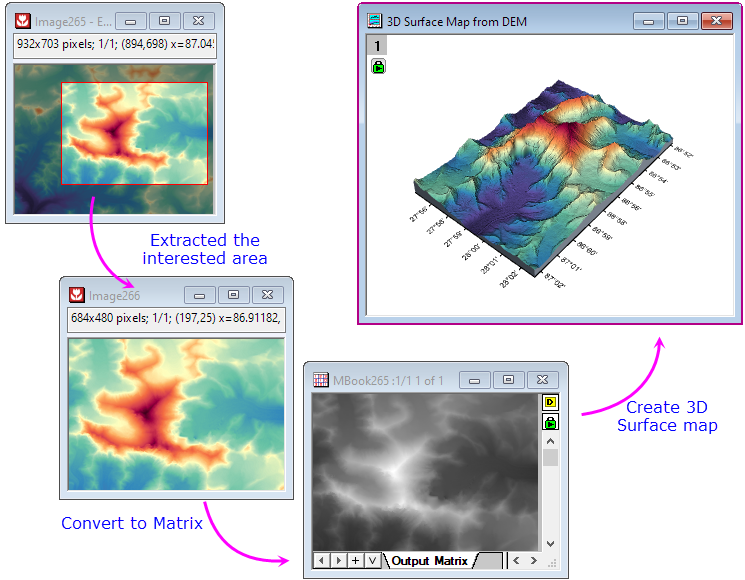
Extract the interested area of GeoTIFF
- For Matrix, you can use select an area using the Rectangle/ Circle/ Polygon/ Region tool
 as region-of-interest (ROI), and then extract data from it.
To know more detail about profiling matrix data on ROI in the NetCDF, please refer to this page
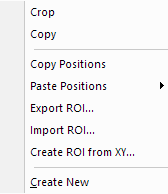
- For Image, extract the interested area that is similar with extracting from Matrix
Right-click on the ROI and choose an option from the shortcut menu.
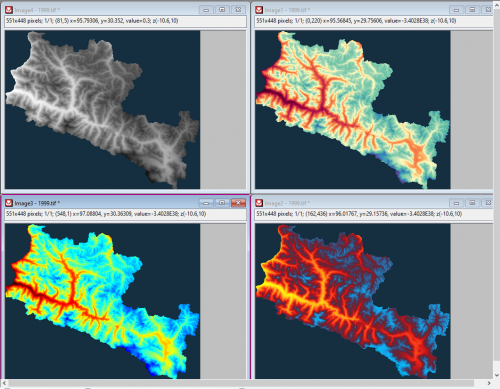
Apply Different Palette
Apply Color Palette
When a image is active, you can use the Palette  button and the Missing Value Color
  button (in Mini Toolbar) to customize color of the matrix window.
If you want to clear the color palette, you can run the follow script in the Script Window:
img.Palette$="";
Reverse Palette
When a image is apply color palette, you can use Reverse Palette  button (in Mini Toolbar) to reverse the color of the palette.
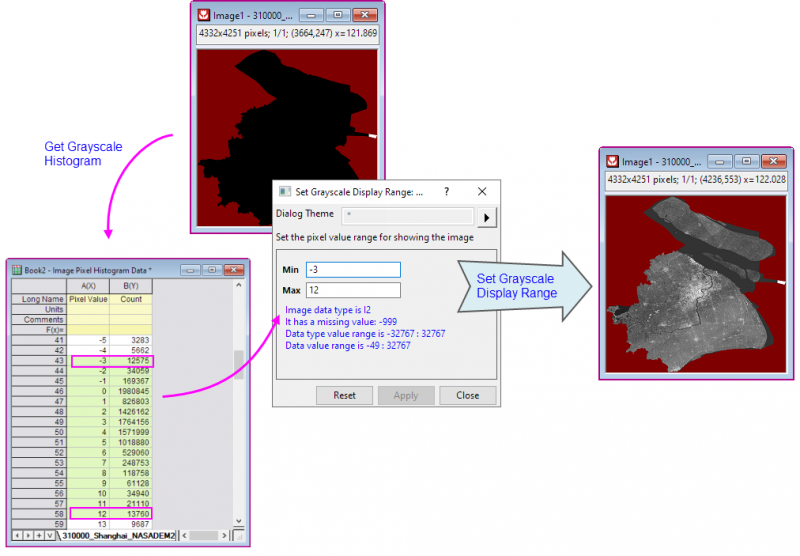
Set Gray Scale Display Range
Sometimes you would find the default display of the gray scale is not good enough or even bad to distinguish. You can fix it by setting the gray scale display range.
1. Determine the gray scale display range
With the Image window active,
- Select Image: Grayscale Histogram menu to open cvhistogram dialog. This will output the pixel intensity distribution, from which you can easily tell the main distribution.
OR,
in case of Grayscale Histogram tool is not available for some image data type,
- Select Image: Convert to Column menu to open cv2col dialog. This will output pixel values point by point. You can later perform frequency count on pixel values to determine the main distribution.
2. Setting gray scale display range
With Image window active,
- select Image: Set Grayscale Display Range menu,
or
- click on the edge of the Image window to show up mini toolbar, click
 button,
This will open cvgraymax dialog. Set the Min and Max pixel value to the main distribution range determined from the previous step.

|
- Active Image window, and select Image: Grayscale Histogram menu. Output the pixel intensity distribution in a new worksheet.
- Observe the output worksheet and find the Pixel Value main distribution.
- Active Image window, and select Image: Set Grayscale Display Range menu. Change the Min and Max pixel values according to the previous step.
|
OR, a simpler and more interactive way,
- Click on the edge of the Image window to bring up the mini toolbar. And then click the Grapyscale Slider button
 .
.
- On the Display Range Fine Tuner that opens, you can change the pixel values for Min and Max respectively. Change Slider From and Slider To according to the main distribution range determined from the previous step, and drag the slider in between to find a "good enough" display range.
Resize the GeoTIFF Image
To resize the GeoTIFF image, you can select Image: Resize to open cvResize, then select interpolation method to reset the image size.
Graphing
Plot Raster Data as Contour, Surface
After import GeoTIFF file to image, you can extracted the interested area. Then select Image: Convert to Matrix, and use Matrix data to plot Contour or Surface and so on.
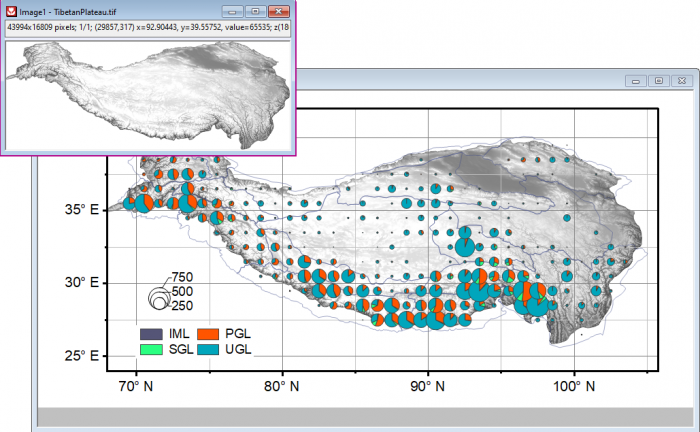
Set GeoTIFF as Backgound of Graph
- Import the GeoTIFF image in to an Image window.
- Activate the Graph window (such as Pie, Bar or Bubble graph) to where you want to insert the image. Select Insert: Image from Image Window to insert the image as background.
Analysis
Import the GeoTIFF files as stacked matrix in Origin, it can get used to Origin's analysis tools as NetCDF files.