This collection of tools and menu-driven operations provides functions which may be helpful in exploring certain "what if" scenarios.
Use the Draw Data tool to hand draw a 2D scatter plot. A hidden worksheet of corresponding XY coordinate values is simultaneously created.
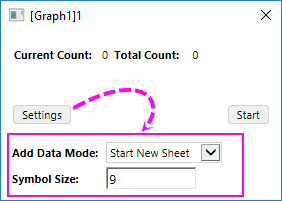
With a graph window activated, clicking the Draw Data toolbar button ![]() will pop up a mini dialog:
will pop up a mini dialog:
Note:By default, the Add Data Mode and Symbol Size options have been floded, you can click on the Setttigns button to expand them.
You can use this option to specify how to store the data points you drawn.
Symbol Size can be used to specify the size of the drawn data points; by default, the size is 9.
Once the worksheet has been created, a button Graph or Worksheet will appear on the tool panel to let you switch the windows.
For more information, see Creating a Data Plot Using the Draw Data Tool.This procedure works only with 2D scatter plots.
You are allowed to move data points of 2D scatter one by one to arbitrary places within the layer to reconstitute the data plot, using the Data: Move Data Points command. For more information, see Moving a Data Point.
Note:
|
You can delete individual data points from your 2D scatter plot using the Remove Bad Data Points menu command. Workbook data are adjusted accordingly. This procedure works only with 2D scatter plots. For more information, see Deleting a Data Point.