Cluster analysis is a common method for constructing smaller groups (clusters) from a large set of data. Similar to Discriminant Analysis, Cluster analysis is also concerned with classifying observations into groups. However, discriminant analysis requires you to know group membership for the cases used to derived the classification rule. Cluster Analysis is a more primitive technique in that no assumptions are made concerning the number of groups or the group membership
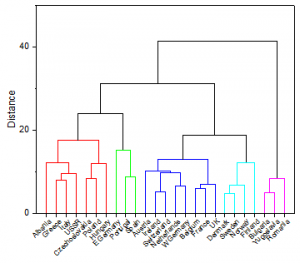
Hierarchical Cluster Analysis is the primary statistical method for finding relatively homogeneous clusters of cases based on measured characteristics. It starts with each case as a separate cluster, and then combines the clusters sequentially, reducing the number of clusters at each step until only one cluster remains. The clustering method uses the dissimilarities or distances between objects when forming the clusters.
Hierarchical Cluster Analysis is most appropriate for small samples. When the sample (n) is large, the algorithm may be very slow to reach a solution. In general, users should consider K-Means Cluster when the sample size is larger than 200.
Hierarchical Cluster Analysis is the only way to observe how homogeneous groups of variables are formed. Note that K-Means Cluster Analysis only supports classifying observations.
There is no definitive way to set the number of clusters for your analysis. You may need to examine the dendrogram and the characteristics of the clusters, and then incrementally adjust the number to obtain a good cluster solution.
If the variables are measured in different scales, you can standardize variables. This results in all variables contributing more equally to the distance measurement, though you may lose variability information in the variables.
| Notes: Both Euclidean and squared Euclidean distance are sensitive when data are standardized. If we want to standardize data during analysis, city block distance should be used. |
| Note When the Centroid method and Median method is selected, squared Euclidean distance is recommended. |
K-Means Cluster Analysis is used to classify observations through K number of clusters. The idea is to minimize the distance between the data and the corresponding cluster centroid. K-means analysis is based on one of the simplest algorithms for solving the cluster problem, and is therefore much faster than hierarchical cluster analysis.
Users should typically consider K-means analysis when the sample size is larger than 100. Note, however, that K-means cluster analysis assumes the user already knows the centroid of the observations, or, at least, the number of groups to be clustered.
The first step in k-means clustering is to find the cluster centers. Run hierarchical cluster analysis with a small sample size to obtain a reasonable initial cluster center. Alternatively, you can specify a number of clusters and then let Origin automatically select a well-separated value as the initial cluster center. Note that automatic detection is sensitive to outliers, so be sure to screen data for outliers before analyzing.
If there are missing values in the training data/group range, the whole case (entire row) will be excluded in the analysis
|
Topics covered in this section:
|