5 The Origin Interface
Origin-Interface
The Origin Workspace
Origin Workspace
This chapter contains basic information on navigating the Origin workspace. Long-time Origin users can skim this chapter.
 | Window size and position are automatically adjusted to accommodate different displays. This is done to accommodate switching between your laptop and a higher-resolution monitor, without having to resize/reposition every window and dialog box. There is a system variable to control rescaling behavior: @SRWS .
|
Windows File Explorer Previews
While not part of the Origin interface, you can use Windows File Explorer (previously "Windows Explorer") to preview graphs in a project file.
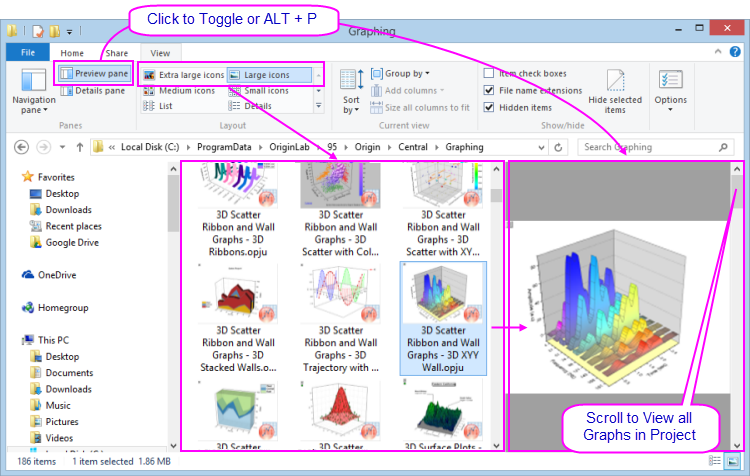
- Windows Explorer's Large or Extra large icons views (right-click in File Explorer and choose View: Large Icons or Extra Large Icons or select from the Explorer View menu) will show an image of the last active graph before the project file was saved.
- Open the Preview Pane (ALT + P) and scroll through all graphs in the project file.
- If you do NOT wish to save graph previews into the file (either in icon view or in the Explorer Preview Pane), you can set LabTalk system variable @PESS=0 or =-1. For information on changing the value of a system variable, see FAQ-708 How do I permanently change the value of a system variable?
Origin Menus and Menu Commands
Menus
- Context-sensitivity of menu bar and menus: The menu bar and menu commands are context-sensitive; they change as you change window type (from worksheet to graph to matrix, for instance). Only menus pertinent to the active window will display.
- Menu bitmaps, toolbar buttons and shortcut keys: Some menu commands also have bitmaps that display to the left of the command. Additionally, you may see a shortcut key combination listed to the right of a menu command. The button bitmap and the shortcut keys indicate alternate ways to access the same functionality.
- Shortcut menu commands: Many commands are available from shortcut menus. To open a shortcut menu, right-click on an Origin object (worksheet window, graph axis, text object, etc.). Only pertinent menu commands will show.
- Collapsible menus: Collapsible MenusFull MenusBy default, main and shortcut menus in Origin are "collapsed", meaning they display an abbreviated set of commands. When you use a menu item which isn't included, it is added to the menu. If you prefer to always see full menus, click Preferences: Options > Miscellaneous tab and clear the Enable Collapsible Menus box.
- Most recently used analysis menu commands: Most-recently used menu commands will appear at the bottom of the analysis menus (Worksheet, Analysis, Statistics, Image, etc.). This gives you quick access to tools when performing repeat operations.
- Most recently used files: Several File submenus (e.g. File: Recent Projects) keep a list of your most recently opened or saved files. Thus, files that you are currently working on are easily located and opened.
- Custom Menu Organizer: Since Origin 8.1, Origin users have been able to use the Custom Menu Organizer Menus, Organizer to add or remove menu items. To learn more, see the chapter Customizing Origin, later in this Guide.
| There is a plain-text log of all Origin file activity. The file is named as "OriginProjHistory.txt" and saved to User Files (Help: Open Folder: User Files Folder). Maximum number of entries is controlled by system variable @MHF (default = 1000).
|
Origin Toolbars
Toolbars, Customizing
Use the Customize Toolbar dialog box (View: Toolbars) to control toolbar display and reset or reinitialize toolbars.
- Customize toolbar button appearance: Use controls on the Options tab of the Customize Toolbars dialog box to modify button and toolbar appearance.
- Dock/Float a toolbar: Toolbars can be undocked and made to float on the workspace. To float a toolbar, hover over the left-end of the toolbar. When the pointer becomes a four-headed arrow, drag the toolbar off of the toolbar space. To return the toolbar to its former docked position, double-click the toolbar title bar.
- Hide/Show a toolbar: Clicking the Close button on a floating toolbar removes the toolbar from view. To restore a hidden toolbar, open the Customize Toolbars dialog box and on the Toolbars tab, place a check mark beside the toolbar.
- Hide/Show a button: Click the small arrow at the right end of a toolbar and open a flyout menu to enable/disable toolbar buttons.
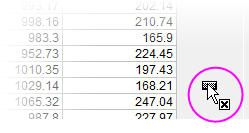
- Move/Hide button: Alt + drag a button to move it to a new position within or between toolbars. Alt + drag to an empty portion of the workspace to create a new toolbar; ; or to hide a button, Alt + drag a button to any child window (cannot be empty workspace) and when the button displays as "X", release to hide the button in the toolbar.
- Hide/Show all toolbars in the Origin interface: Select View: Hide Toolbars menu or press the hotkey Ctrl+Alt+R
For more information on customizing Origin's standard toolbars, see Customizing Toolbars and Buttons, later in this User Guide.
Mini Toolbars
OriginLab continues to add Mini Toolbar support for common objects and tasks. These toolbars appear when the user selects an object or when the user clicks in certain key areas inside the page. Available controls depend on context (selected object, window type, etc).
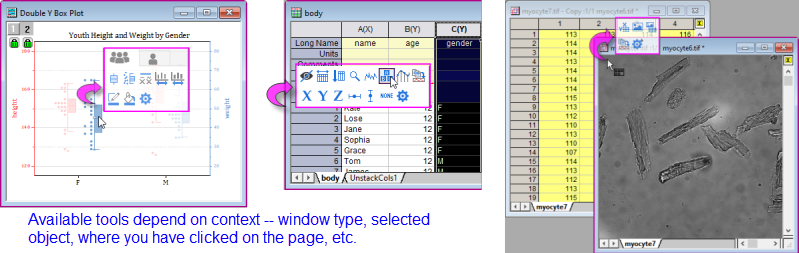
- Before using Mini Toolbars, make sure there is a checkmark beside View: Mini Toolbars (default).
- To display the toolbar, select an object such as a data plot, a text label, or a worksheet cell.
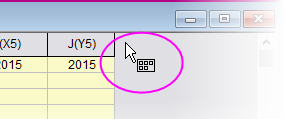
- In addition, there are toolbars for more-general page- and layer-level customizations and these toolbars are displayed by hovering near the margins of the window. When you see your mouse cursor change to something like this
 , this is your cue that clicking in this spot will display a Mini Toolbar of relevant tools.
- Most Mini Toolbars have a Properties button
 that gives access to more complex settings (e.g. a graph window's Plot Details dialog box).
- If you move away or you do not act quickly enough, a Mini Toolbar will fade away. To restore a Mini Toolbar after it has faded, press the SHIFT key.
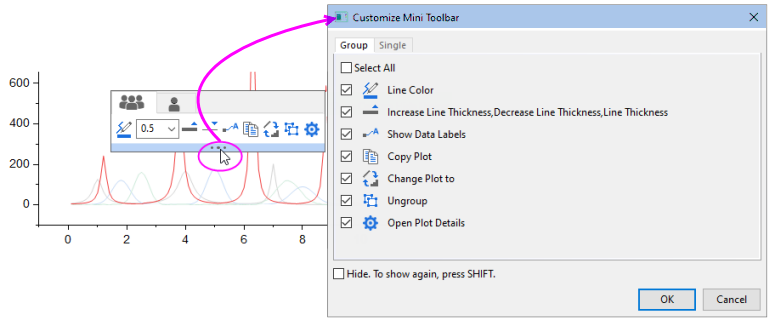
- To add or remove buttons from a Mini Toolbar, click on the three dots at the bottom center of the toolbar. This opens the Customize Mini Toolbar dialog box where you can enable or disable buttons as needed.
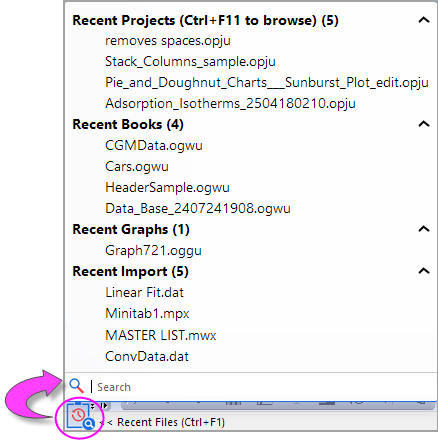
Recent Files
There is a magnifying-glass icon over an Origin logo at the left-bottom corner. Hover on the icon + logo with your mouse, then click on it, then it will pop up to show the recent items with a search tool. You also can press the Ctrl+F1 button on your keyboard to pop-up it.
Search Tool
There is a search box with magnifying-glass icon at last of main menu.
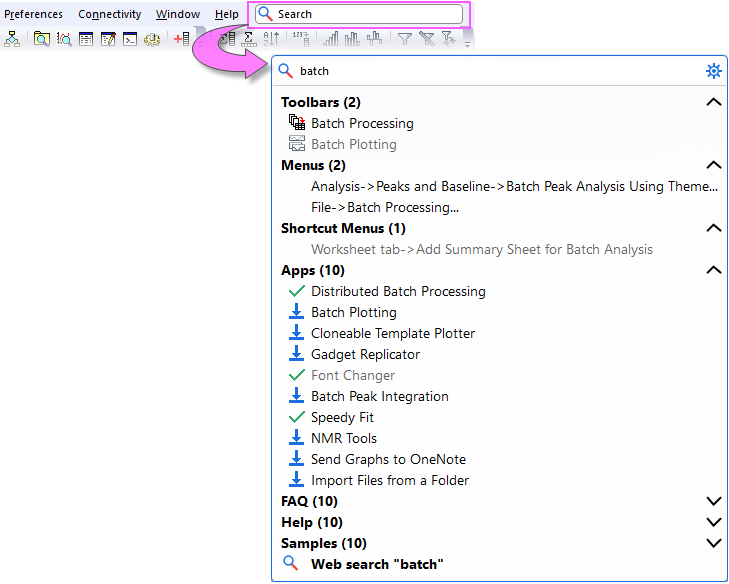
When you first click the box, the search tool will index with progress bar scrolling. Once the indexing is finished, you can enter the keyword(s) to search available resources. Press the F1 button on your keyboard will also expand the search panel.
Then all Origin resources related to the keyword(s) will be listed in these categories:
- Toolbars
- Menus
- Mini Toolbars
- Shortcut Menus
- Apps
- FAQ
- Help
- Samples
- Templates
All these categories will be shown as collapsible sections with number of items displayed. If no result is found under the categories, the sections will be hidden.
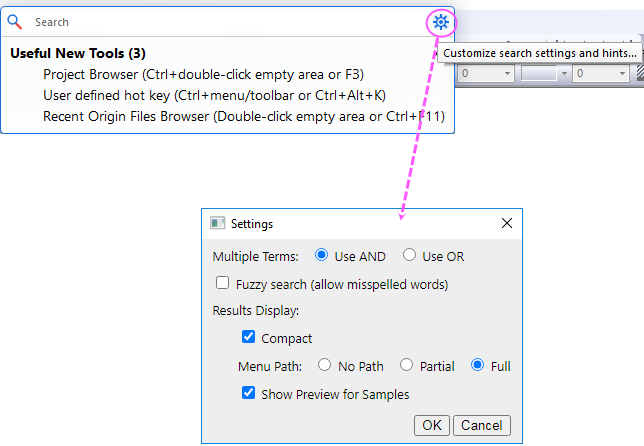
Without entering any keyword, only Useful New Tools are listed in the panel. Click the Settings button beside the Search box to open the Settings dialog to customize the searching mechanism and the results display.
Learning Center
Learning Center is a "startup" dialog that gives quick access to graphing and analysis examples, plus learning resources (tutorials, videos, the OriginLab blog, etc.).
- To open the dialog, choose Help: Learning Center or press F11.
- Check or clear the Show on Startup box to show or hide this dialog each time Origin starts.
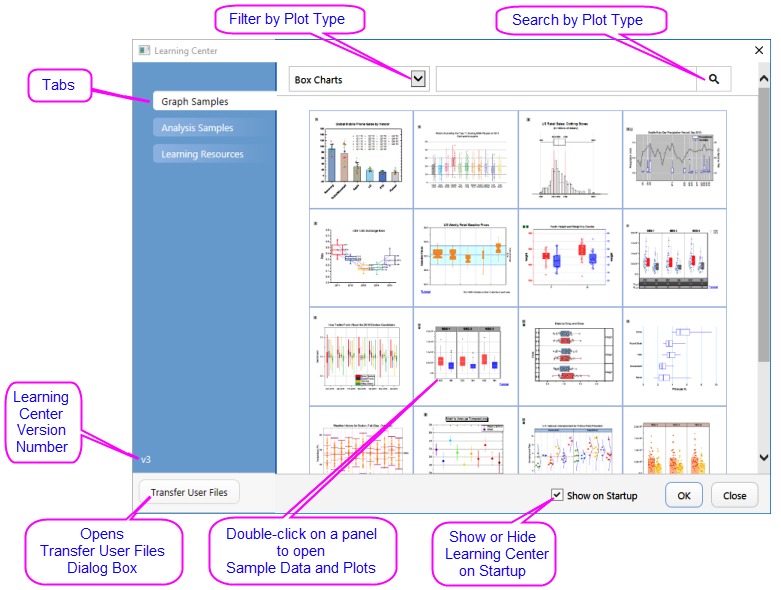
- View and load sample graphs, including sample data and notes on re-creating the graph.
- Load analysis samples with data.
- Browse the Learning Resources tab for tutorials and videos and links to the Origin Blog, User Forum and Origin social media pages.
- Move files from your previous User Files Folder to your new User Files Folder.
| To see new graphs in newest version, open the Learning Center, click the Graph Samples tab, set the plot filter drop-down to All Plot Types and search the version number, such as 2024.
|
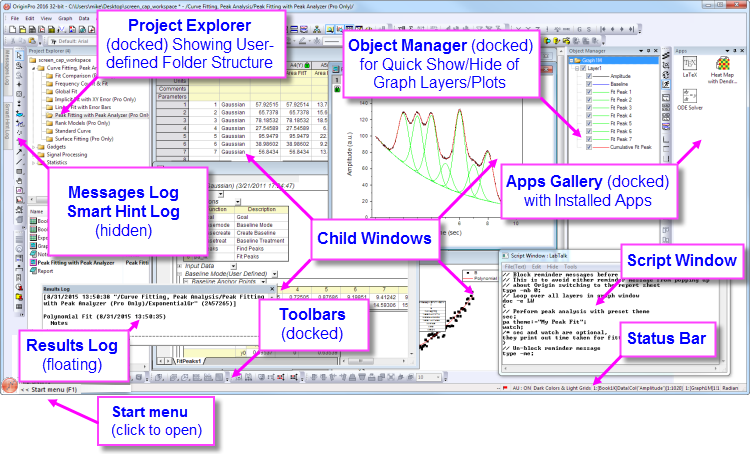
Project Explorer
Project Explorer (PE) is a tool to help you organize the contents of your Origin project files (OPJ).
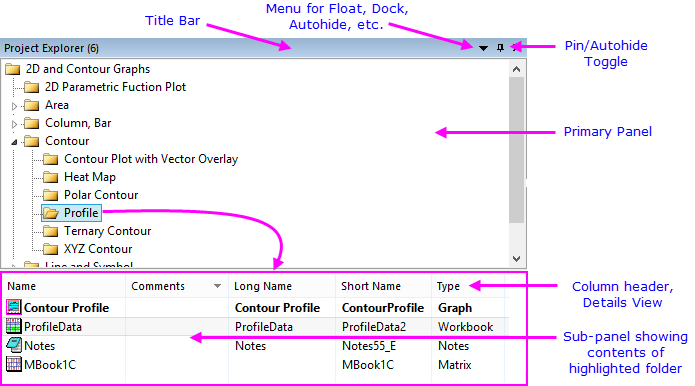
Project Explorer (PE) is split into two panels. The primary panel shows the OPJ folder structure. The sub-panel shows windows contained in the folder that is highlighted in the primary panel.
| Prior to 2018, the PE sub-panel listed sub-folders in the folder selected in the top panel. To restore this display mode, set the value of system variable @PEF = 1.
|
Using Project Explorer to manage your projects
- Right-click the PE title bar or click the drop-down menu to display the panels stacked (Vertical Alignment) or side-by-side (Horizontal Alignment).
- Context menus in both panels provide options to delete, hide, print, etc. Menu options vary depending on what is selected or where you have right-clicked.
- Multiple-selection of windows in the sub-panel is supported (press Shift or Ctrl while clicking with your mouse).
- The sub-panel supports differing views of windows: Details (default), List, Small Icons, Large Icons, Extra Large Icons.
- In any view, mousing over a window icon shows a popup preview of the graph, worksheet, matrix, layout, image, or notes window.
- Control display of popup previews by right-clicking in the subpanel and placing a check mark beside Hold Ctrl Key for Preview Popup. Henceforth, popups will only appear as you press CTRL.
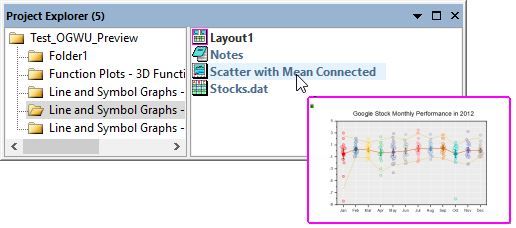
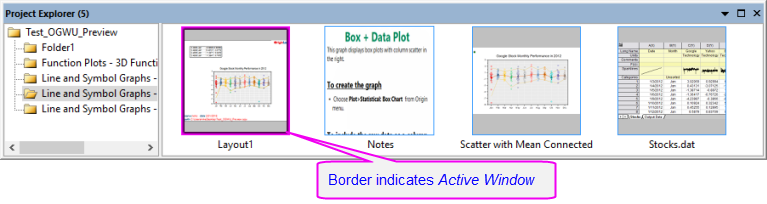
- When displaying windows as Extra Large Icons, the PE sub-panel displays a thumbnail of graphs, layout windows, workbooks, matrixbooks, images and notes window.
- You can right-click on PE folder (upper panel) and choose Copy -- or select the folder and do a CTRL + C and CTRL + V -- to copy and paste the folder structure and content to (a) another folder in the current project or (b) another project running in a second Origin session. To copy a single workbook window, right-click on the window (lower panel) and copy and then paste the window to (a) another folder in the same project, or (b) to a new project running in a second Origin session.

|
- Select Help: Open Folder: Program Folder, click the Samples subfolder, then drag the file Tutorial Data.opj to your Origin workspace.
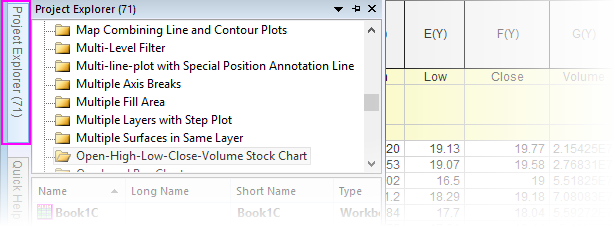
- By default, Project Explorer is docked to the left side of the Origin workspace in auto-hide mode. Mouse over the Project Explorer tab to show the PE window.
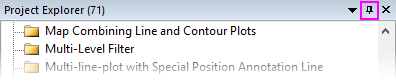
- Click on the "push pin" icon on the PE title bar to pin the window in the docked position.
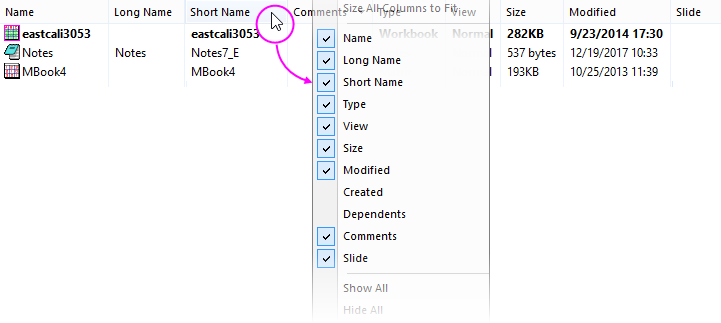
- By default the sub-panel is in Details view. In this view, window metadata such as Name, Size and Comments show below these column headings. Try dragging column headers to reorder them.
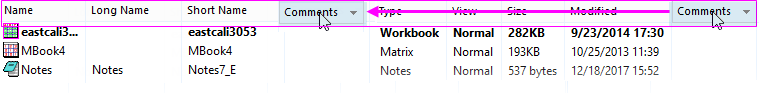
- Right-click on the column headings and show or hide any of the headings by checking or unchecking the box beside each.
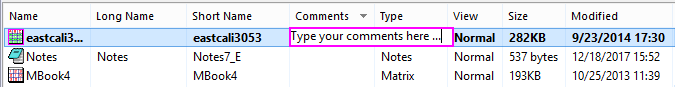
- To add a comment in the Comments field, click once, pause briefly and click a second time. This puts you into edit mode. Enter a comment.
-
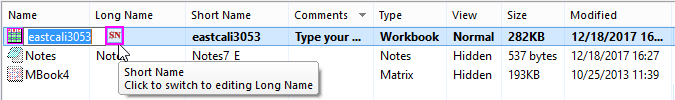
- To change the Name of a window, right-click in the row and choose Rename. By default, the Name field displays the window Short Name; or if a window Long Name exists, the window Long Name (all windows must have a Short Name but Long Names are optional). Click the SN or LN button to the right-side of the editable Name field to edit the Short Name or Long Name. If the Long Name does not exist, you can enter one.
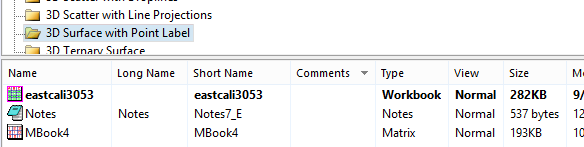
- In the top panel of Project Explorer, scroll to the folder 3D Surface with Point Label and click on it. The sub-panel shows that there are three windows in the folder. Note that the worksheet window eastcali3053 is bold indicating that it is the "active" window - the window that is being acted upon as well as the window that determines what operations are available. There is also a Notes window, and a matrix window named MBook4.
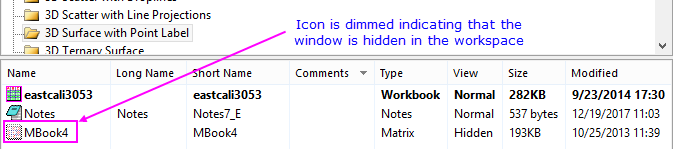
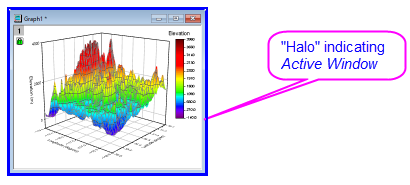
- In the sub-panel, double-click on MBook4 and note that it is now bold and has a magenta "halo", indicating that it is the active window. You will also see that the whole window(in the workspace) displays with a halo which can be customized in color with the system variable @AWC-- another indicator that this is the "active" window. Double-click on this MBook4 icon again and note that the icon is now dimmed. Note also that the actual window disappears from the workspace. This is because MBook4 is now hidden. Double-click the MBook4 icon again and the window is restored and made active.
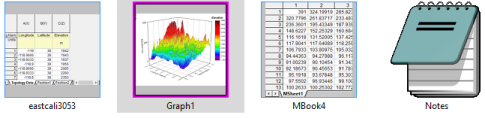
- With MBook4 active, click Plot > 3D: Surface: 3D Colormap. This creates a 3D colormap surface graph (close the attention message). Note also that a new window -- Graph1 -- has been added to the sub-panel of Project Explorer.
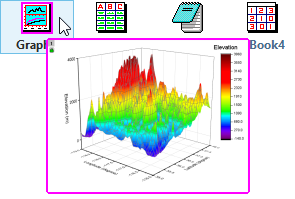
- Right-click in an empty portion of the sub-panel and choose View: Extra Large Icons. Note that Graph1 now displays a graph thumbnail.
- Right-click again and choose View: Large Icons. Note that windows are now represented by icons but if you hover on them, you can see the window contents as a pop-up.
|
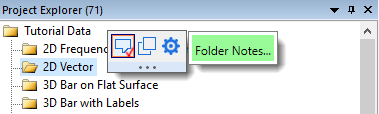
Folder Notes
You can add Folder Notes to a PE folder.
- Right-click on a folder and choose Folder Notes .
- If no folder Comment exists, this adds a blank Folder Notes window to the folder (see this page for options for adding and displaying Notes window content).
- If there is existing Comment (hint: right-click on the folder and choose Properties), adding Folder Notes will copy the Comment to the Folder Notes window.
- When switching between folders, for example using the new Folders and Windows toolbar, these Folder Notes will always be displayed in the workspace, if pinned or minimized.
- If you close Folder Notes (i.e. by clicking the Close button
 ), they are embedded in the folder and will only be displayed again by right-clicking on the folder in PE and choosing Folder Notes.
In addition ...
- Press Ctrl + hover on a PE folder to see rendered Notes window content.
- System variable @FNS is added to determine which is the default Folder Notes syntax (= 0 (Text), = 1 (HTML), = 2 (Markdown), or = 3 Origin Rich Text (default)).
- A Mini Toolbar is added for adding Folder Notes, Duplicate Folder or to Open Folder Properties Dialog.
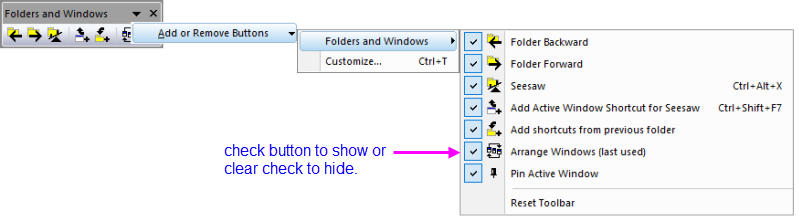
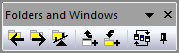
Folders and Windows Toolbar
| A Folders and Windows toolbar is added for working with Project Explorer folders and folder contents. When first running Origin, you may see this new toolbar "floating" in the Origin workspace. You can drag it (by the title bar) to an empty portion of the toolbar spacer; or you can choose View: Toolbars and click the Reinitialize button to reset toolbars to the standard configuration.
|
The Folders and Windows toolbar makes it easier to switch between PE folders ('Seesaw) or to add the active window as a shortcut in the previous folder; plus, to pin the active window in place or to arrange windows in the active folder Window: Arrange Windows <Last used>.
- Folder Backward: From current folder, return to previous folder.
- Folder Forward: From previous folder, return to current folder.
- Seesaw: Alternate between two folders (Ctrl + Alt + X). From the menu, Windows: Seesaw.
- Add Active Window Shortcut for Seesaw: Share the active window to the previous folder as a shortcut (Ctrl + Shift +F7). Alternately, right-click the window title and add shortcut to previous folder.
- Add shortcuts from previous folder: Add shortcuts by window type, to the current folder.
- Arrange Windows (last used): Same as Window: Arrange Windows <Last used>.
- Pin Active Window: Pin window so that it isn't included when Arrange Windows (last used) is clicked. Alternately, right-click the window title and Pin Window (or unpin).
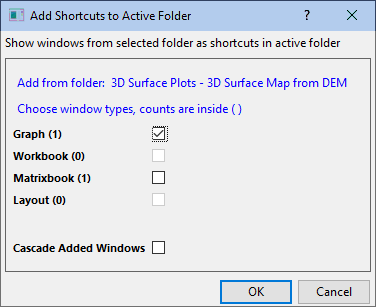
Window Shortcuts
When you are in a Project Explorer folder, you can hover on another folder, right-click and Add Shortcuts. This opens a dialog for adding windows as shortcuts, by type, to the active folder.
-
- When a shortcut window is added to the active folder, a home button ("Go to original")
 . Clicking the button will navigate to (and activate) the original window in its containing folder.
- A shortcut window will display the name of the PE folder in parentheses, on the window title bar.
- Clicking Close
 on a shortcut window will hide the shortcut in the current folder.
- To remove shortcuts from the active folder, right-click on the folder in Project Explorer and Remove Shortcuts (dimmed when there are no shortcuts to remove).
- Minimized or maximized windows added as shortcuts will be restored up or down so that they are visible but do not fill the workspace.
Apps Center and App Gallery
Apps Gallery
Apps are add-on applications for Origin that perform specific graphing and/or analysis tasks. A small number of Apps that are broadly applicable to science and engineering fields are pre-installed with your Origin software.
Use the App Center dialog for browsing, updating or downloading Origin Apps. This new dialog gives you direct access to all of the Apps on the OriginLab File Exchange without you having to open a browser and navigate there.
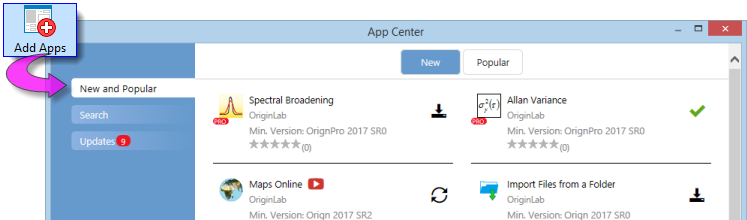
To launch the App Center, click the Add Apps button that appears on all tabs of the Apps Gallery, docked at the right-side of your Origin workspace. If you do not see the Apps Gallery, click View: Apps (or ALT + 9) and verify that there is a check mark beside Apps.
- Installed and Up-to-date Apps will appear in the App Center with a green check mark beside them

- Installed Apps for which there is a newer version will appear with an Update icon beside them

- Those not installed will appear with a clickable Download and Install icon beside them

Origin's Statistics, Analysis: Fitting and Analysis: Peaks and Baseline menus include a Find Apps entry. Clicking Find Apps opens the App Center to show only Apps that relate to the current menu (e.g. Statistics). You can download or update Apps directly from the App Center.
Use the Apps Gallery to organize and access your installed Apps.
| New Apps and App updates are are continually made available to Origin and OriginPro users. Be sure to open your App Center occasionally (press F10) and if it displays the red Download Now button, click to get the latest list of available Apps.

|
For more information on Apps, please visit www.originlab.com/apps.
Object Manager
Object Manager
The Object Manager is a dockable panel that opens to the right side of the workspace, by default. Use the Object Manager for quick manipulation of the active graph or workbook window.
Graph Windows
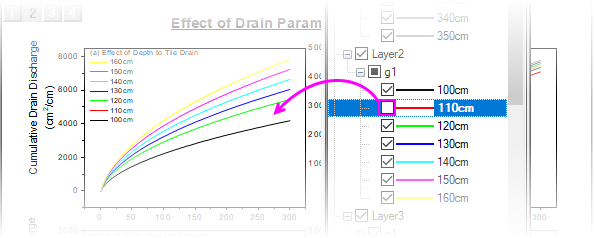
- Select an element (layer, plot group, data plot or special point) in the Object Manager to select the corresponding element in the graph window and vice versa. Selection also (a) dims all other plots in the graph layer and (b) selects the source data in the worksheet.
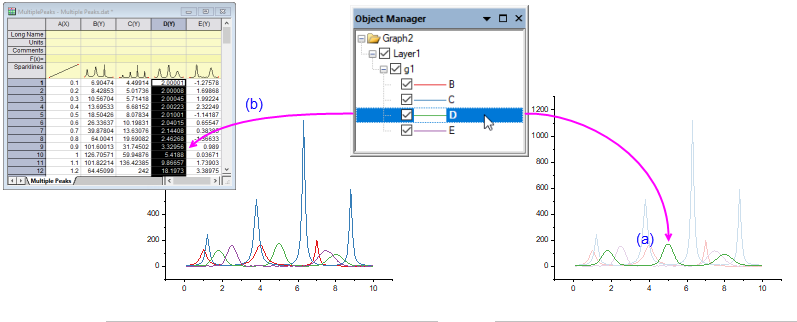
- Object Manager can show a "Graph Objects" view and a "Plots" view of graph windows. To toggle between the two views right-click in an empty portion of the Object Manager and choose Show Plots/Show Graph Objects; or press Ctrl + Shift + S.
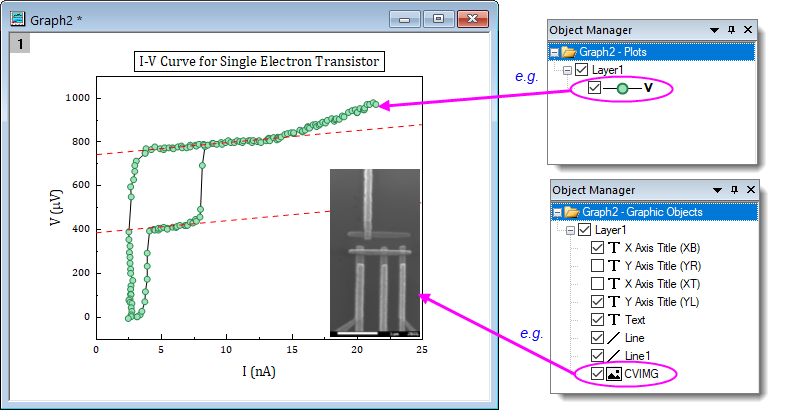
- Hide or show plots or graph objects by clearing or checking the corresponding box in the Object Manager.
- At the graph level, change Object Manager list order (Drawing Order or its reverse -- Order of Appearance ).
- At the layer level, change layer order.
- At the plot level, show labels, show or hide plots, reorder plots or create plot groups.
- Within a plot group (labeled as gN), ungroup plots, re-order plots by dragging or by shortcut menu command, change plot type.
- Remove a plot (permanently) from the graph window.
- Access the Plot Details, Layer Contents and Plot Setup dialog boxes.
- Right-click on the layer icon and Reverse Plot Order.
Workbook or Matrix Windows
The Object Manager also supports certain actions for workbooks and matrices:
- List all sheets in the active workbook or matrix.
- Quickly select multiple sheets by pressing CTRL + Up/Down arrow.
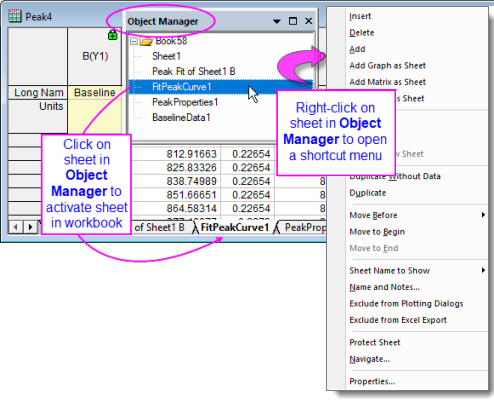
- Click a sheet in Object Manager to activate the corresponding sheet in the workbook or matrix.
- Right-click in Object Manager for access to common worksheet operations, including Delete, Insert, Add, Move, Copy, and Duplicate.
- Right-click on a matrix or virtual matrix in Object Manager to Rename.
Layout Windows
When a Layout Page is active, the Object Manager lists and allows arrangement of objects via shortcut menu commands.
- All objects, including added graphs, tables and text objects, list in the Object Manager.
- Hide or show objects by clearing or checking the adjacent box.
- Select multiple objects in Object Manager, then right-click and align or distribute them using shortcut menu commands.
Origin Child Windows
Child Windows
| Active windows -- the window that will be acted upon by graphing and analysis operations -- display a colored frame to make the active window more obvious. You can customize the active window indicator properties (frame color, where the frame shows, frame line style) with "@ System Variables" @AWC (color) and @AWI (style).
|
- Workbooks: The Origin workbook provides a framework for importing, organizing, analyzing, transforming, and plotting your data. The tabbed workbook contains between 1 and 1,024 sheets. Each sheet may contain more millions of rows and more than 65,000 columns of data. In addition to your data, workbook windows may also store graphs, annotations, column-based functions, scripts and programmable button objects, LabTalk variables and import filters.
- Matrixbooks: Like the worksheet, a matrixsheet is a grid of cells, arranged in rows and columns. The primary difference is that in the worksheet, each column is a dataset and each dataset can be configured to contain various types of data (text, text & numeric, numeric (double), numeric (int), etc). In contrast, the matrix is a single, numerical dataset of Z values, related in the XY plane by row (Y) and column (X) index numbers. The matrixbook contains between 1 and 1,024 sheets. Each sheet can contain multiple matrix objects (up to 65,504).
- Graphs: The graph window is the primary container for your data plots. Origin supports over 100 chart types, chosen specifically for their applications in various technical fields. Each chart is created using a built-in, user-modifiable graph template that can be saved with your custom settings. In addition to data plots, the graph may also contain annotations (text and drawing objects) or button objects that, when triggered, perform some custom graphing or analysis task. Graph windows can be inserted into worksheet cells or "floated" on worksheets (outside the grid) in a workbook window.
- Images: The image window is a window for importing, viewing and editing raster images and videos (.avi, .mov, .mp4).
- Function Graphs: The function graph is a specialized graph window that displays a curve described by a function. The function graph differs from other Origin graphs in that it is not produced from a dataset of discreet values (though you can generate data after plotting).
- Layout Pages: The layout window allows you to combine and arrange graph and worksheet windows and various annotations onto a single "display panel." It is used primarily for creating presentations.
- Excel workbooks. Excel workbooks can be opened or created in Origin. Workbooks can be saved separately or as part of your Origin project file.Excel
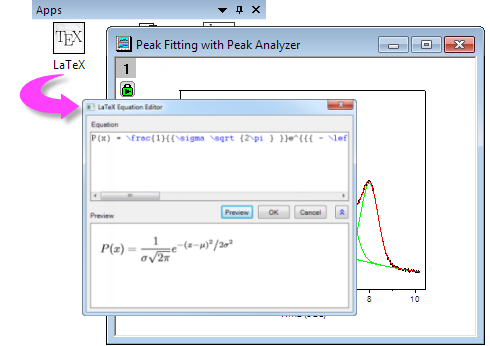
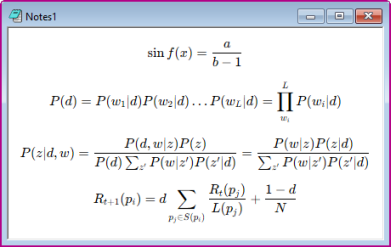
- Notes: The Notes window supports plain text, Rich Text, HTML and Markdown. Use it for simple tasks such as recording analysis procedures, making notes to students and colleagues, and cutting and pasting text from other applications; or use it for rendering highly formatted text, including HTML reports and mathematical expressions.
| Note: For more information on Origin's child windows, see
Help: Origin: Origin Help > Origin Basics > Elements of the Origin Workspace > Creating a Child Window
Help: Origin: Origin Help > Origin Basics > Elements of the Origin Workspace > Basic Child Window Operations
|
To save an Origin child window independently of the Origin project file:
- Select File: Save Window As... to save active window. File extensions OGW(U), OGG(U), OGM(U) are for Origin Workbook, Graph and Matrix windows, respectively.
- Right-click the window title bar and choose Save as... from the context menu.
Note: To save an Excel window as an external Excel file, right-click the Excel window title in Origin and choose Save Workbook as... from the context menu.
| Origin 2018 added Unicode (UTF-8) support for Origin projects, child windows and templates. When you save a window file -- with the exception of the project file which as of Origin(since 2023) can only be saved as Unicode-compliant (*.opju) -- you will have the option of saving a file with or without a "u" appended to the file type (*.otp or *.otpu). If you intend to use the file only in the latest version of Origin, you should choose the Unicode-compliant (appended "u") option as it offers some performance advantages.
|
To open a worksheet, graph, matrix, or notes window that was saved to a file:
- Select File: Open or click the Open button
 on the Standard toolbar to open window files.
- Select File: Recent Books, File: Recent Graphs to open recently saved workbook and graph window files.
Note: Origin supports window Short Name, Long Name and Comments and the Short Name must be unique in the Origin project. The window Short Name will be renamed if such a name has already exists in the project. If you open window file in the current project, then save the project, the window will be included in the project.
To open an Excel workbook file:
- Select File: Open Excel menu to open a external Excel file. Or, you can click Import Excel button in the Standard toolbar or select Data: Import from File: Excel (XLS, XLSX, XLSM)... from the main menu to import the Excel file.
Note: If you choose Open Excel, the Excel file is opened as an Excel workbook, in an Excel session that runs inside Origin. In this mode, you have only limited access to Origin features. If you choose Data: Connect to File: Excel or Data: Import From File: Excel, the Excel file is imported into an Origin workbook and all Origin features are available.
Arranging Child Windows
Origin includes some window arranging tools that go beyond the basic Tile and Cascade functionality. Users in industry and research who work with high resolution monitors and many windows should find the tools helpful.
| - The new Folders and Windows toolbar has a Pin Active Window button that is used to exclude the active window when windows are arranged by menu command or toolbar button. Clicking this button adds a pin button
 to the window title bar. Alternately, right-click on any window and choose Pin Window from the shortcut menu. to the window title bar. Alternately, right-click on any window and choose Pin Window from the shortcut menu.
- Occasionally, you may decide -- after arranging windows -- to enlarge a window for better viewing. You can restore the window to its previous size and position by clicking Window: Restore Window Size (Ctrl + Shift + Z).
|
Arrange Windows Dialog
Central to using these tools is the Arrange Windows (winarrange) dialog (Window: Arrange Windows).
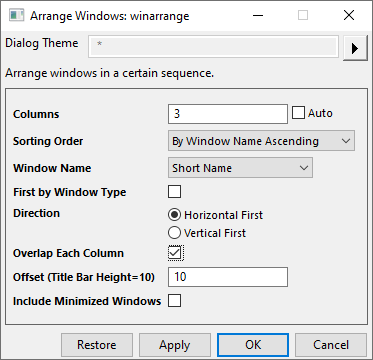
Use the dialog to sort and arrange windows in the Origin workspace.
- Arrange windows into columns.
- Sort by order of activation, Project Explorer order, or window name (ascending, descending).
- Sort within window type.
- Horizontal (left to right) or vertical direction (top to bottom).
- Overlap each column (cascade) by user-defined Offset.
- All above arrangement include minimized windows or not.
Snapping Windows
Windows that are arranged in rows and columns can be "snapped"; that is, dragged and resized along a common edge. The visual cue for engaging the snap is a green bar.
- Toggle this feature off or on using Window: Snap Windows (Ctrl+F12).
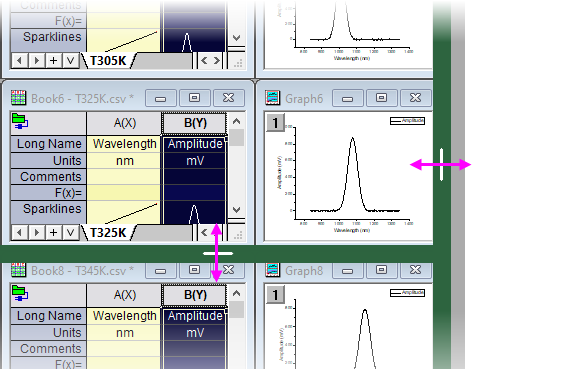
- To resize a single window without snapping, press SHIFT while dragging window border.
- When tiled windows cover the workspace, swap two window positions by pressing ALT while dragging the window title bar.
- To snap a window into an empty space, press SHIFT while dragging.
Float and Pin Child Windows
From Origin 2023b, Child Windows can be moved outside of the Origin workspace as independent floating windows. Such windows have customizable Menus and Toolbar buttons, so you don’t have to move back to the main Origin window to access them.
Float windows are auto pinned so that they will remain when switching folders in Project Explorer.
Pinned window inside Origin will auto remain when switching folders in Project Explorer. To roll back to old behavior, set system variable @pws=0.
The Command Window and Script Window
The Command Window can be used to issue LabTalk commands to Origin, to do simple mathematical calculations, or to check the value of LabTalk variables. The Command Window maintains a time-stamped command history that can be carried over from session to session, and intellisense which provides auto-completion features when writing X-function commands. The Command Window is dockable and has two panels. The left-hand panel displays the command history, while the right-hand panel provides the command line.
The Script Window predates the Command Window. It does not support all Command Window features (there is no command prompt and no scrollable command history) but it is handy for running simple LabTalk commands at the cursor (run multi-line scripts by highlighting the entire script and pressing Enter). In addition, the window's Tools menu also opens the LabTalk Variables and Functions dialog box where you can view a list of Origin variables, functions, macros, loose datasets, etc.
| Script Window also supports for Unicode, auto-completion, syntax-coloring, and font-size control/zoom (Ctrl + mouse wheel). These features should improve usability, particularly for those with 4k monitors. If you want a "plain text" Script Window, set @NSW=0 (for help with setting the value of a system variable see this FAQ).
|
To open the Command Window:
- Click the Command Window button
 on the Standard toolbar. Alternately, select Window: Command Window menu or press ALT+3.
To open the Script Window:
- Select Window: Script Window menu or press SHIFT+ALT+3.
The Formula Bar
The Formula Bar is similar to formula bars in OpenOffice and Excel. While it is not necessary to use the Formula Bar to enter cell expressions, it does offer the advantages of function search, interactive range selection and improved visibility of expressions, particularly of long expressions that exceed cell width.
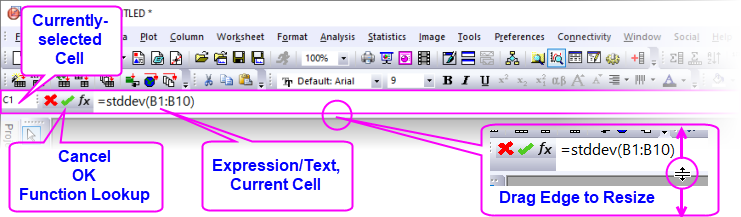
- With a workbook active, toggle the Formula Bar on or off by clicking View: Formula Bar on the main menu.
- To change font size, change the value of LabTalk system variable @FBFS (default is "130").
For more information, see the Workbooks, Worksheets and Columns chapter.
| - The Search Functions dialog that is opened from the Function menu in certain dialogs (e.g. Set Column Values) can be opened by clicking Tools: Search Functions.
|
The Status Bar

The Status Bar Status Bar is located at the bottom of the Origin workspace. It reports multiple parameters, including:
- Help messages and tool descriptions.
- Statistics on the current workbook, matrix or graph selection.
- Whether the AutoUpdate analysis feature is turned on.
- The name of the System Theme, if any.
- Information pertinent to the active window.
- Angular unit (radians, degrees, or gradians).
- Tool tips for functions listed in the Set Values F(x) menu.
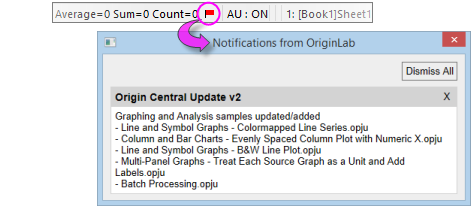
- Notifications from OriginLab, represented by a small red flag to the right side of the Status Bar.
Customize and Copy Status Bar Data
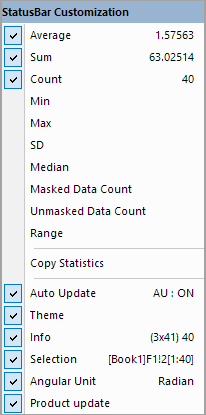
- You can select what shows in the Status Bar by right-clicking on the Bar and selecting (or clearing) items from the context menu.
- Copy displayed statistical values by selecting Copy Statistics from the context menu. The copied data are TAB separated between quantity and values, with each key value pair separated by a CRLF delimiter.
Smart Hints and the Smart Hint Log
Hints, SoftwareSmart Hints
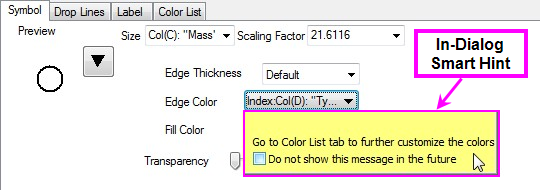
Smart Hints are triggered by user actions and are intended to give the user help with current task. These hints may appear briefly inside a dialog box, as in this example.
Alternately, Smart Hints may appear in the lower left corner of the Origin workspace, as in this example.
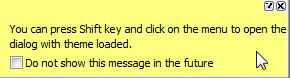
Unless you hover over a Hint, it will quickly fade. You can prevent display of individual Smart Hints by checking the "Do not show this message in the future" box at the bottom of a Smart Hint.
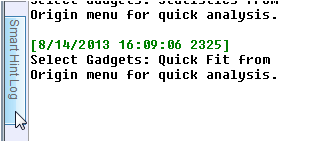
Hints are logged for the current Origin session and can be reviewed by clicking the Smart Hint Log tab, docked at the edge of the Origin workspace (Note that in-dialog Hints are not logged).
To open (and close) the Smart Hint Log window:
- From the Origin menu, select View: Smart Hint Log or press ALT+7.
To prevent a particular Smart Hint from displaying again in the current session, right-click on the hint in the Smart Hint Log window and check Do not show this hint again from the context menu. A message asks you to confirm that you do not want to show or log this message.
To turn off all Smart Hint display in the session, open the Script Window and type the following:
@SHS = 0;
To turn on Smart Hint display (including those were individually hidden), type @SHS = 1, and click Help: Reactivate All Hints.
| When you set the value of a system variable using the Script Window, you are altering Origin's behavior for the current session only. To set the value of a system variable across sessions, see this FAQ.
|
Code Builder
Origin C, IDE
Origin integrated development environment (IDE) is called Code Builder. Code Builder provides tools for writing, compiling, and debugging your Origin C functions. Additionally, it can be used for running and debugging Python code.
To open Code Builder:
- From the Origin menu, select View: Code Builder or click the Code Builder button
 on the Standard toolbar or press ALT+4.
- Code Builder can also be opened by clicking Connectivity: Open untitled.py. In this mode, you can paste and run Python code by pressing CTRL + F5.
Messages Log
The Messages Log window shows messages about operations including Output Information, Results and Errors. It displays messages that are not sent to the Script Window or the Command Window.
To open (and close) the Messages Log window:
- From the Origin menu, select View: Messages Log or press ALT+6.
Clickable link of export results
Export dialogs (see bullet list in image) will add a date-time stamped clickable link to the Messages Log. Click the link to open the file with the default application (e.g. Notepad for *.dat).
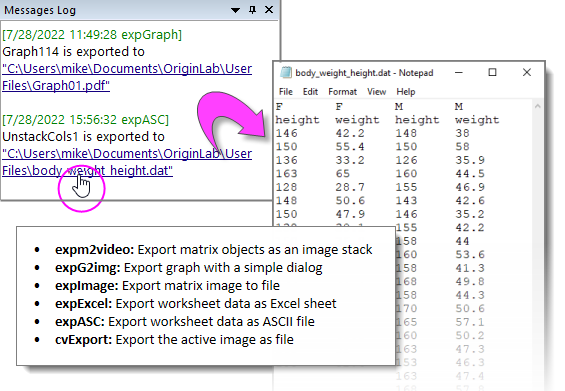
- To open file location in Windows Explorer without opening the file, right-click on a link and choose Open File Location; or press Ctrl while clicking on the link.
- Two system variables are added to control image export link behavior. See Exporting Graphs and Layout Pages to an Image File for more information.
Results Log
Origin automatically types many analysis and fitting results to the Results Log. Each entry in the Results Log includes a date/time stamp, a window name, a numeric stamp which is the Julian day (see Dates below), the type of analysis performed, and the results.
In most cases, when results are reported to the Results Log, it opens automatically. Manually open (or close) the Results Log by doing one of the following:
- Click the Results Log button
 on the Standard toolbar. Alternately, from the Origin menu, select View: Results Log or press ALT+2.
Right-click in the Results Log to open a shortcut menu with commands to Copy, Print, Clear..., and View Results.
Float, Dock and Auto-Hide Windows
Windows, Dock/Float/Auto-Hide
There are several Origin windows, which can be floated, docked, auto-hidden, or hidden. These windows include Project Explorer, Results Log, Command Window and Messages Log. This allows you to customize your Origin workspace so as to maximize utility and save screen space.
Context Menu
Context Menu
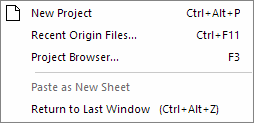
Right-click on the grey workspace area, you can create a new project, open Recent Origin Files and Project Browser dialog, or return to the last window.
Dark Mode
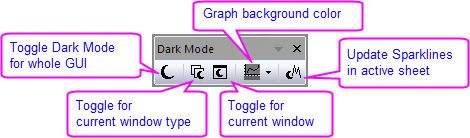
Dark mode is supported from Origin 2024.
- By default, Origin follows Windows dark mode settings. You can use the Dark Mode toolbar or System Variable @CTP to turn on/off Dark Mode independently. Besides, there are buttons on the Dark Mode toolbar to toggle dark mode for individual window for particular window type.
- Multiple built-in dark color themes available under Preference: Dark Theme menu.
- When exporting or copying dark-mode graph as image, there is option to copy/export as displayed, or without dark mode applied
Numbers in Origin
Numbers in Origin
- Displayed vs. Actual Cell Value: When you import or type your data into a workbook or matrixbook, Origin uses a combination of user-specified settings to determine how to display the data in each cell. What displays is a visual representation of the data value. The actual data values are stored with the full precision allowed by the dataset's Data Type (see table below). When you perform calculations, it is the actual data values that are used and not the displayed values.
- When Contents Exceed Cell Width: Prior to Origin 2020b, if the sequence of characters in a sheet cell exceeded what could be displayed at the current cell (column) width, Origin represented cell contents as a series of pound signs (######). This has changed to mimic MS Excel's worksheet behavior:
- Text strings will not trigger display of pound signs ###### regardless of column width. To view the full string, you must increase column width.
- Numeric values that exceed column width will first be rounded to the nearest decimal and only if that is not sufficient to display the full integer value, will pound signs ###### display in place of the numeric value.
- This rounding of numeric values affects the displayed value only. The internally-stored value does not change.
- To restore the old behavior of displaying pound signs ###### whenever cell contents were not fully displayed, set system variable @WPE = 1. For information on changing the value of a system variable, see this FAQ.
- Missing Values in the Worksheet: When spreadsheet programs first appeared it was recognized that there was a need for a special number that was "not a number" which would - when used in a calculation - generate itself. Origin has such a number and its internal value is -1.23456789E-300. Because Origin recognizes this value as a special value, it can be used to enter a missing value into a worksheet or matrix and it can be used in calculations or scripts (for instance, to return a missing value unless some condition is met). Origin displays missing values in a worksheet or matrixsheet as "--". However, you shouldn't confuse this display (output) with what you enter as a missing value (input).
- Decimal, Scientific and Engineering Notation: You can display workbook or matrixbook data in Decimal:1000, Scientific:1E3, Engineering:1k, and Decimal:1,000 notations. You can manually choose from these data display options but you can also pre-define thresholds for automatic display of scientific notation. By default, these thresholds are set to 6 (upper) and -3 (lower).
- Dates and Times in Origin: Origin's long-time mathematical system for dates and time is based on Astronomical Julian Day Numbers, with a 12 hour offset. This system defines January 1, -4712 (January 1, 4713 BCE), 12 hours Greenwich Mean Time as zero. Recently, two alternate time systems were added: (1) a true Julian Date value (0 is at noon instead of the following midnight) and (2) a "2018" system in which 0 is defined as 00:00 on January 1, 2018. The 2018 system supports greater precision when, for instance, importing data with the Import Wizard (e.g. Custom Date Format supports "MM'/'dd'/'yyyy HH':'mm':'ss'.'######"). Previously, precision was limited to 0.0001 seconds. For more information, see Dates and Times in Origin.
| Note: For more information on numbers, see
Help: Origin: Origin Help > Origin Basics > Elements of the Origin Workspace > Numbers in Origin
|
Origin workbooks and matrixbooks support the following Data Types:
| Workbook
|
Matrixbook
|
Bytes
|
Range of Values
|
|
double
|
double
|
8
|
±1.7E±308 (15 digits)
|
|
real
|
float
|
4
|
±3.4E±38 (7 digits)
|
|
short
|
short
|
2
|
-32,768 to 32,767
|
|
long
|
int
|
4
|
-2,147,483,648 to 2,147,483,647
|
|
char
|
char
|
1
|
-128 to 127
|
|
byte
|
char, unsigned
|
1
|
0 to 255
|
|
ushort
|
short, unsigned
|
2
|
0 to 65,535
|
|
ulong
|
int, unsigned
|
4
|
0 to 4,294,967,295
|
|
complex
|
complex
|
16
|
±1.7E±308 (15 digits), each 8 bytes
|
Topics for Further Reading