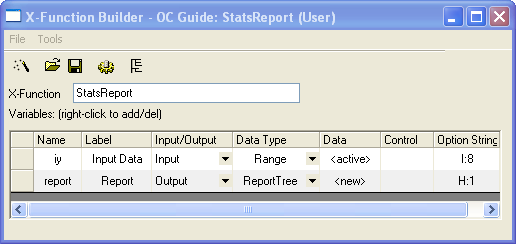
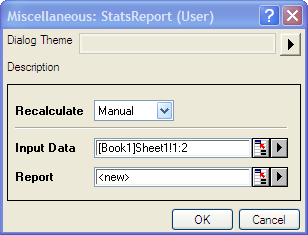
In the X-Function main function StatsReport, add the following code to get the data from the specified data range, do statistics, and generate a report sheet.
X-Function, Statistics
if ( !_check_input(iy) )
{
// if input is not valid,
// show error message and
// abort X-Function execution.
XF_THROW("Invalid input data");
return;
}
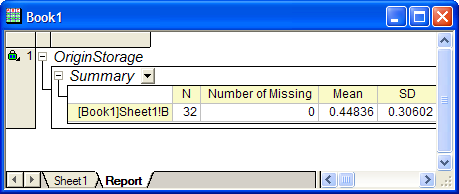
//create table to show statistics summary.
ReportTable rt = report.CreateTable("Summary",_L("Summary"),
TABLE_ID_BEGIN);
//report table's column headers.
const vector<string> vsColLabels = {
"N",
"Number of Missing",
"Mean",
"SD",
"SEM",
"Sum",
"Variance"
};
int nRowID = ROW_ID_BEGIN;
int nRanges = iy.GetNumData(DRR_COLUMN_INDEX |
DRR_NO_FACTORS);
for ( int nRange = 0; nRange < nRanges; nRange++ )
{
// get the subrange - one column
DataRange drOne;
iy.GetSubRange(drOne, DRR_COLUMN_INDEX |
DRR_NO_FACTORS, nRange);
// get range string, like [Book1]Sheet1!A
string strDataLabel;
drOne.GetRangeString(strDataLabel);
vector vInput;
drOne.GetData(&vInput, 0);
if ( vInput.GetSize() == 0 )
{
// print out warning message when column is empty
// and then go to the next column
warning_msg_box(
strDataLabel + ", empty column found.",
false, 'W');
continue;
}
int N, Missing;
double dMean, dSum, dVariance, dSD, dSE;
int nRet = ocmath_basic_summary_stats(vInput.GetSize(),
vInput,
&N, &dMean, &dSD, &dSE, &dVariance, &dSum,
NULL, NULL, NULL, NULL, NULL, NULL, &Missing);
if ( STATS_NO_ERROR != nRet )
{
// print out warning message when
// statistics function failed.
warning_msg_box(
strDataLabel + ", statistics fails.",
false, 'W');
continue;
}
vector vResults(vsColLabels.GetSize());
vResults[0] = N;
vResults[1] = Missing;
vResults[2] = dMean;
vResults[3] = dSD;
vResults[4] = dSE;
vResults[5] = dSum;
vResults[6] = dVariance;
//add new row to report table.
string strName = "Data" + nRange;
rt.AddRow(strName, vResults, strDataLabel,
vsColLabels, NULL, nRowID++);
}