2.10.35 plotms
Menu Information
Plot : 3D Surface : Multiple Color Fill Surfaces or Multiple Colormap Surfaces
Brief Information
Create 3D surface plot from multiple matrix objects
Additional Information
Minimum Origin Version Required: 8.5 SR0
The option to hide the Graph window is available starting with version 9.0.
Command Line Usage
plotms ml:=[MBook1]MSheet1! type:=mesh;
X-Function Execution Options
Please refer to the page for additional option switches when accessing the x-function from script
Variables
Display
Name
|
Variable
Name
|
I/O
and
Type
|
Default
Value
|
Description
|
| Matrix
|
ml
|
Input
MatrixLayer
|
<active>
|
Specify the matrix sheet, in which all matrix objects will be plotted.
|
| Plot Type
|
type
|
Input
int
|
mesh
|
Specify the graph type to plot all matrix objects in the matrix sheet.
Option list:
- 0=mesh:Color Fill Surface
- All matrix objects are plotted as color fill surfaces.
- 1=cmap:Color Map Surface
- All matrix objects are plotted as colormap surfaces.
- 2=stacksurf:Stacked Surface
- Matrix objects are plotted as stacked surface.
- 3=stackheat:Stacked Heatmap
- Matrix objects are plotted as stacked heatmap.
|
| Hide Newly Created Graph
|
hide
|
Input
int
|
0
|
Specify whether to hide the newly created graph.
|
Description
Many 3D graphs can be created from Matrices. When a matrix sheet has more than one object, these objects can be plotted in one layer, such as Multiple Color Fill Surfaces graph.
This X-Function is used to plot all the matrix objects in the specified matrix sheet. Two graph types are selectable: color fill surface and colormap surface.
Examples
The following example will show how to plot color fill surfaces of the generated matrix objects in the matrix sheet, and then hide the grid lines and set transparency to 50%.
- Create a new project, and then run the following LabTalk script in the Script Window to generate the desired matrix objects.
newbook mat:=1;
int nmats = 10;
range msheet=1!;
msheet.Nmats = nmats;
matrix -v x+y;// first one fill differently
range mm=1;mm.label$="x+y";
double ff=0;
loop(i, 2, nmats-1) {
msheet.active = i;
ff = (i-1)/(nmats-2);
matrix -v (5/ff)*sin(x) + ff*20*cos(y);
//set LongName
range aa=$(i);
aa.label$="$(5/ff,*3)*sin(x) + $(ff*20)*cos(y)";
}
//fill last one with random
msheet.active = nmats;
matrix -v rnd();
range mm=$(nmats);mm.label$="random";
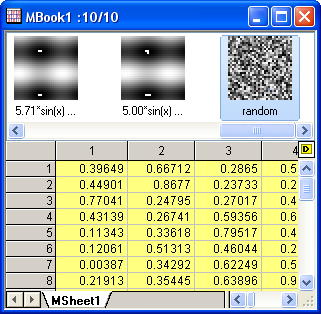
matrix -it;//show thumbnails
Ten matrix objects are generated.
- Activate the newly created matrix book, then run command
plotms -d in the Script Window to open the plotms dialog. Set Type to Color Fill Surface.
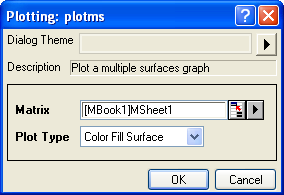
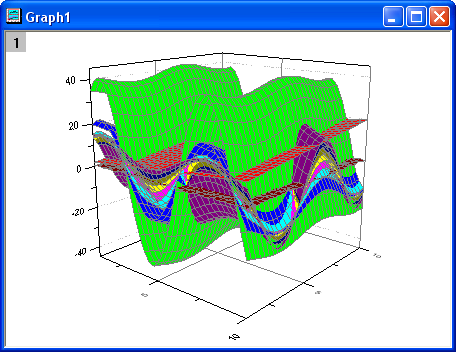
- Click the OK button to create the color fill surfaces.
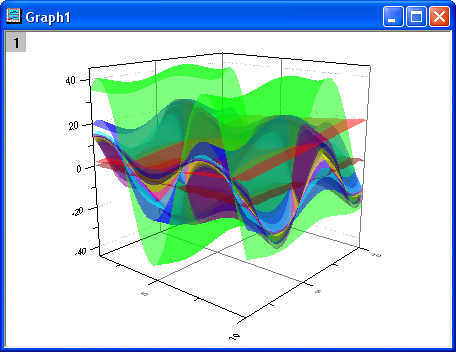
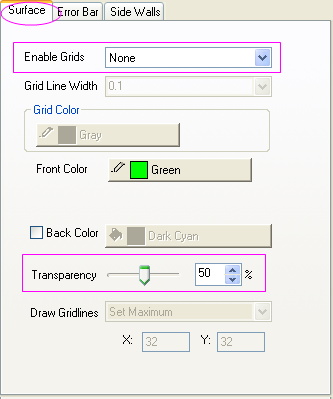
- Double-click on the surfaces to open the Plot Details dialog. Select the first surface from the left panel of the dialog, and then switch to the Surface tab in the right panel. Set Enable Grids to None and Transparency to 50%.
- Select other surfaces from the left panel one by one to change the same settings as the last step does. Then click the OK button to close the Plot Details dialog and get the final graph.