Plot > Multi-Panel, Multi-Axis : Multiple Panels....
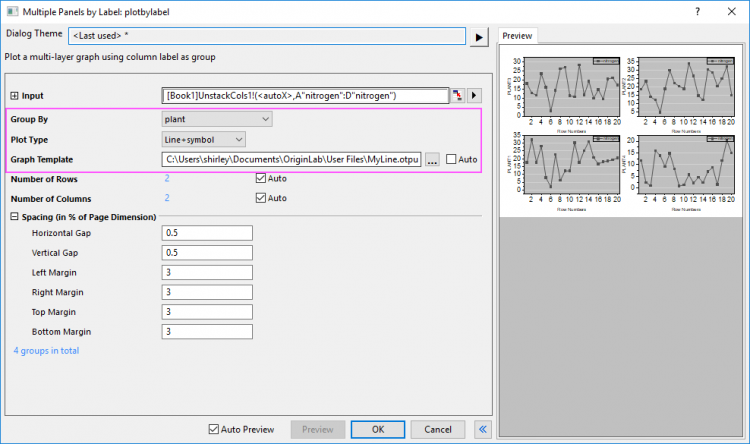
Plot a multi-layer graph using column label as group
Minimum Origin Version Required: 8.1 SR0, updated in 8.5.1 SR0
Hiding the graph is available starting with 9.0, controlling gaps between layers is available starting with 2016 SR0.
Specifying a graph template is available starting with 2021b.
plotbylabel iy:=[book1]1!((1,2),(1,3),(1,4)) group:=U plottype:=2 rows:=3 cols:=1;
plotbylabel iy:=[Book1]1!((1,2),(3,4),(5,6),(7,8),(9,10),(11,12),(13,14),(15,16)) group:=L plottype:=1 rows:=4 cols:=2 hgap:=10 vgap:=10 tmg:=5 bmg:=5;
plotbylabel group:=C plottype:=linesymb template:=C:\Users\shirley\Documents\OriginLab\UserFiles202002\MyTest.otpu;
Please refer to the page for additional option switches when accessing the x-function from script
| Display Name |
Variable Name |
I/O and Type |
Default Value |
Description |
|---|---|---|---|---|
| Input | iy |
Input XYRange |
|
Specify the input data ranges. |
| Group By | group |
Input string |
|
Specify the group identifiers for plotting the input data ranges; Or, use the X columns as separators to plot the Y columns into multiple layers; Or, use the specified number of groups to divide the input ranges and plot them into multiple layers.
|
| Plot Type | plottype |
Input int |
|
Specify a plot type.
Option list:
|
| Graph Template | template |
Input int |
|
Specify a plot template to apply formats and settings on the panels. Auto means applying the default template mgroups.optu; Uncheck Auto box to select a template file by clicking the ... button. |
| Number of Rows | rows |
Input int |
|
The layers will be arranged in an N by M grid. This variable specifies M, the number of rows in the grid. |
| Number of Columns | cols |
Input int |
|
The layers will be arranged in an N by M grid. This variable specifies N, the number of columns in the grid. |
| Horizontal Gap | hgap |
Input int |
|
Specifies the horizontal gap in % of page size between adjacent layers. |
| Vertical Gap | vgap |
Input int |
|
Specifies the vertical gap in % of page size between adjacent layers. |
| Left Margin | lmg |
Input int |
|
Specifies the left margin in % of page size to the new graph page. |
| Right Margin | rmg |
Input int |
|
Specifies the right margin in % of page size to the new graph page. |
| Top Margin | tmg |
Input int |
|
Specifies the top margin in % of page size to the new graph page. |
| Bottom Margin | bmg |
Input int |
|
Specifies the bottom margin in % of page size to the new graph page. |
| Hide Newly Created Graph | hide |
Input int |
|
Specify whether to hide the newly created graph. Note that this option is hidden in the dialog. One can only assign its value through Labtalk script.
|
This X-Function plots multiple XY ranges into different layers according to group identifiers, X column separators or group size. The group identifiers can be specified by Long Name, Units, Comments or any other customized headers.
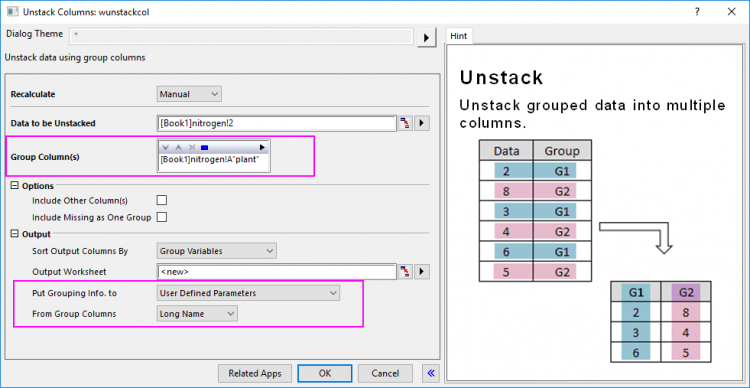
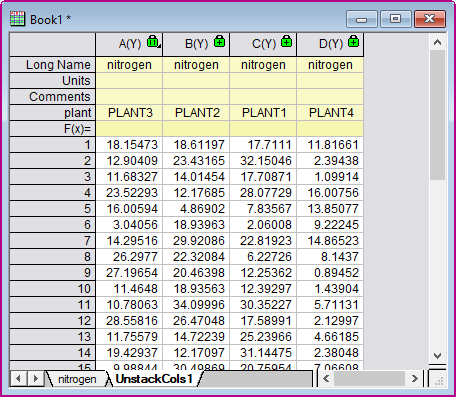
This example is going to plot the unstacked data ranges. First of all, we need to generate the unstacked data by using the wunstackcol X-Function.