2.8.15 interp3
Menu Information
Analysis: Mathematics: 3D Interpolation
Brief Information
Perform 3D interpolation
Command Line Usage
1. interp3 (Col(1), Col(2), Col(3), Col(4)) pts:=5;
X-Function Execution Options
Please refer to the page for additional option switches when accessing the x-function from script
Variables
Display
Name
|
Variable
Name
|
I/O
and
Type
|
Default
Value
|
Description
|
| Input
|
irng
|
Input
Range
|
|
The input range.
|
| Number of Points in Each Dimension
|
pts
|
Input
int
|
10
|
Number of points in each dimension.
|
| X Minimum
|
xmin
|
Input
double
|
|
Specifies the X minimum value of this interpolation.
|
| X Maximum
|
xmax
|
Input
double
|
|
Specifies the X maximum value of this interpolation.
|
| Y Minimum
|
ymin
|
Input
double
|
|
Specifies the Y minimum value of this interpolation.
|
| Y Maximum
|
ymax
|
Input
double
|
|
Specifies the Y maximum value of this interpolation.
|
| Z Minimum
|
zmin
|
Input
double
|
|
Specifies the Z minimum value of this interpolation.
|
| Z Maximum
|
zmax
|
Input
double
|
|
Specifies the Z maximum value of this interpolation.
|
| Output
|
rd
|
Output
ReportData
|
[<input>]<new>
|
The output result.
|
Examples
- Import the data \Samples\Mathematics\3D Interpolation.dat.
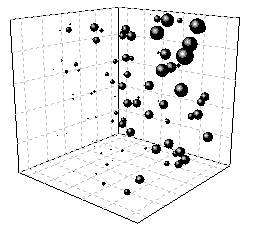
- Highlight column C and right-click. In the fly-out menu, select Set As : Z to set it as Z column. Then click Plot : 3D XYZ : 3D Scatter to create a 3D graph.
- To give a visual impression on what the original data is, we can set column D as symbol size. Double click the 3D Scatter to bring up the Plot Details dialog. Expand all branches on the left panel and select Original. Then in the Symbol tab of right panel, select Col(F) from Size drop-down list and click OK. The 3D Scatter will looks like:
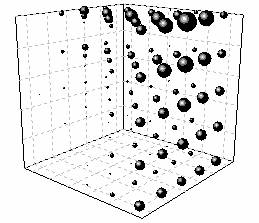
- To interpolate these data, active the worksheet, and select Analysis : Mathematics : 3D Interpolation to bring up the X-Function dialog. Enter column X, Y, Z, F to Input branch respectively. Enter 5 on Number of Points in Each Dimension box, which means it will generate 5*5*5 = 125 interpolated points. Then click OK to do interpolation.
- To verify the result, active the output result worksheet, and plot a 3D scatter plot as above, using Col(F) as symbol size. The interpolated graph will looks like:
More Information
Please refer to this page in the User Guide for more information:
Related X-Functions
minterp2
Keywords:interpolate