Analysis: Mathematics: Trace Interpolation
Perform trace/periodic interpolation of XY data
1. interp1trace iy:=Col(2) method:=spline npts:=50;
2. interp1trace iy:=Col(2) method:=bspline;
Please refer to the page for additional option switches when accessing the x-function from script
| Display Name |
Variable Name |
I/O and Type |
Default Value |
Description |
|---|---|---|---|---|
| Input | iy |
Input XYRange |
|
The XY range to be interpolated. |
| Method | method |
Input int |
|
Specifies the interpolation method.
|
| Number of Points | npts |
Input int |
|
Specifies the number of interpolated points. If npts is not specified, default <auto> = min( n*5, 1000), where n is the number of input points. i.e. if number of points n is less than 200, npts=5*n, otherwise npts=1000. |
| Output | oy |
Output XYRange |
|
The XY range of interpolation result. See the syntax here. |
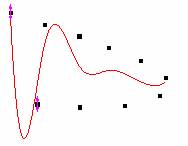
When a curve is cyclic, or periodic, it is improper to use ordinary interpolation because the algorithm interpolates the curve based on adjacent data points in the X coordinate. This causes the cycle trend to be lost.
This function interpolates a curve and keeps the trend.
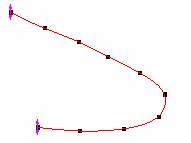
1. Import the file \Samples\Mathematics\ Circle.dat.
2. Highlight the data and plot a scatter.
3. Select Analysis: Mathematics: Trace Interpolation from menu to bring up the dialog.
4. Select Cubic B-spline interpolating method, and enter 50 on the Number of Points edit box.
5. Click OK to execute.
Detail algorithms please refer to the help of interp1.
interp1, interp1q, spline, bspline, interp1xy, interpxyz
Keywords:interpolate, extrapolate