Analysis: Mathematics: Integrate
Integrate XY data
This feature is updated in 8.0 SR5. For more details, please refer to Release Notes. Updated in 8.5.1
Please refer to the page for additional option switches when accessing the x-function from script
| Display Name |
Variable Name |
I/O and Type |
Default Value |
Description |
|---|---|---|---|---|
| Input | iy |
Input XYRange |
|
Specify the input data to be integrated. Note that beginning with Origin 2020b, there is a shortened syntax that follows the form [Book]Sheet!(X,Y1:YN), X = the common X column and Y1:YN = a contiguous range of Y columns to the right of the X column. More complex strings from non-contiguous data of the form [Book]Sheet!((X,Y1:YN),(X,YM:YO)) are also possible. |
| Use End Points Straight Line as Baseline | baseline |
Input int |
|
Specify whether to create a straight line that crosses the end points and use it as the baseline for the integration. |
| Area Type | type |
Input int |
|
Specify the integral area type. Please see more details in the More Information part below.
Option list:
|
| Output Quantities | quantities |
Input TreeNode |
|
Specify the quantities to be outputted when rd is selected. See more details in Dialog Options table: Output Quantities on this page |
| Integral Curve Data | oy |
Output XYRange |
|
Specify the range of the cumulative result. See the syntax here. |
| Integration Result | rd |
Output |
|
Controls output of the Integration Result. |
| Plot Integral Curve | plot |
Input int |
|
Specify whether to plot the integral curve, and where to plot the integral curve. Option list:
|
| Beginning X | x1 |
Output double |
|
Specify whether to output the beginning X value. |
| Ending X | x2 |
Output double |
|
Specify whether to output the ending X value. |
| Index for Beginning X | i1 |
Output int |
|
Specify whether to output the index for beginning X. |
| Index for Ending X | i2 |
Output int |
|
Specify whether to output the index for ending X. |
| Area of the Integration | area |
Output double |
|
Specify whether to output the integration area. |
| Maximum Height | y0 |
Output double |
|
Specify whether to output the maximum Y value in source curve. |
| X Value in Maximum Height | x0 |
Output double |
|
Specify whether to output the X value that corresponds to the maximum height. |
| Peak Width at Half Height | dx |
Output double |
|
Specify whether to output the peak width at half height of the source curve. |
| tr |
Output TreeNode |
|
Use to store output quantities (x1, x2, i1, i2, etc.) when there are multiple XY input ranges | |
| Rescale Source Graph | rescale |
Input int |
|
Specify whether to rescale the source graph when the integral is plotted into it. This check-box is available when the Plot Integral Curve is Source Graph. |
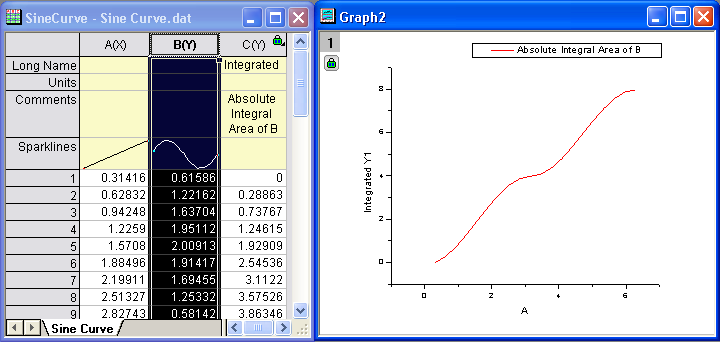
This X-Function performs integration on input data. It can calculate the Mathematical Area (the algebraic sum of trapezoids) or an Absolute Area (the sum of absolute trapezoid values). Missing values are ignored.
If you want to integrate data with the absolute area method and plot the integral curve, you can do the following:
Please refer to this page in the User Guide for more information:
Keywords:integration