Add scrollbar to graph for zooming and panning
1. axis_scrollbar axis:=top;
2. axis_scrollbar begin:=5 end:=10 rescale:=1;
Please refer to the page for additional option switches when accessing the x-function from script
| Display Name |
Variable Name |
I/O and Type |
Default Value |
Description |
|---|---|---|---|---|
| Position | axis |
Input int |
|
Specifies the position of the axis scrollbar and the axis that is associated with it.
|
| Scroll Range Begin | begin |
Input double |
|
Specifies the initial value of the scale. |
| Scroll Range End | end |
Input double |
|
Specifies the final value of the scale. |
| Layer index to scroll | layer |
Input int |
|
Specifies the index of the layer, to which the scrollbar will be added. |
| Reset Scale | rescale |
Input int |
|
Specifies whether to rescale the layer according to the begin variable and the end variable as soon as the scrollbar is added to the graph layer. |
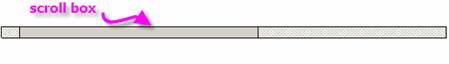
This X-Function adds an axis scrollbar to a graph layer, allowing user to zoom and pan the layer easily.
The axis scrollbar is comprised of a scroll box and a scroll area. The scroll box can be resized and moved. The ratio of its size to the size of the whole scrollbar reflects the ratio of the current range to the full range. To zoom in the layer, make this scroll box larger; to zoom out, make it smaller. The relative position of the scroll box reflects the initial value and the final value of the scale. Therefore, you can move this scroll box so as to pan the layer.
1. To add a top axis scrollbar to the active graph, run axis_scrollbar -d; to open the Axis Scrollbar dialog. Then, select Top as Position in the dialog.
2. To specify the initial and end values of the scale while adding the scrollbar, run axis_scrollbar -d; to open the Axis Scrollbar dialog, and then change the settings in the dialog of the X-Function "axis_scrollbar".