Gadgets: Rise Time
Calculate rise or fall time of data plot within a region of interest
This feature is for OriginPro only, updated in 8.1 SR1.
addtool_rise_time trGUI.rectcolor:=21 trGUI.tool:=1 trGUI.method:=1 trGUI.output_to.reslog:=1 trGUI.display.risetime:=1;
Please refer to the page for additional option switches when accessing the x-function from script
| Display Name |
Variable Name |
I/O and Type |
Default Value |
Description |
|---|---|---|---|---|
| Settings | trGUI |
Input TreeNode |
|
It can be used to customize the computation options. Please see more details in the Description section. |
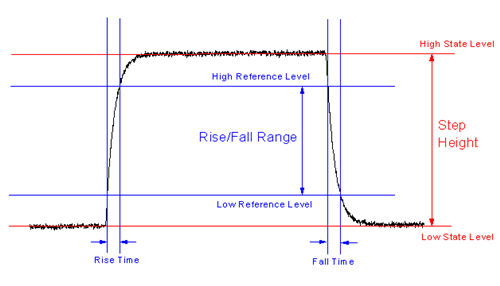
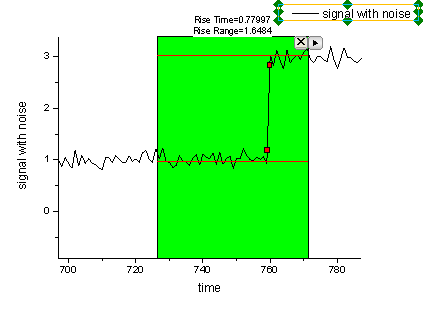
Rise time (or fall time) refers to the time required for a signal to change from a specified low value to a specified high value (or from a specified high value to a specified low value). Typically, these values are 10% and 90% of the step height. This function allows you to select an area on the graph intuitively with a rectangle that is added to the graph and calculate the rise time or fall time within the area.
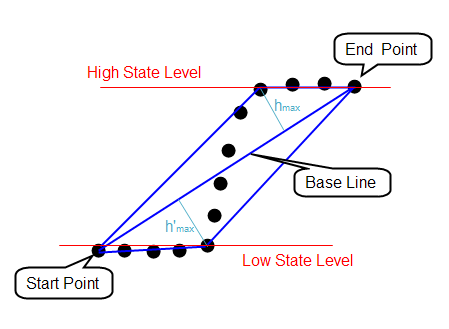
In a step-like signal, a low state level and a high state level are calculated. Then the step height can be calculated by deducting the low state level from the high state level. Then a low reference level and a high reference level are calculated with two specified percentages of the step height. Finally, we can locate the rise time (or fall time) span and calculate the time required for the signal to rise from the low reference level to the high reference level (or drop from the high reference level to the high reference level). The relationships of these parameters are shown in the picture below.
The trGUI tree specifies all setting options for the addtool_rise_time X-Function.
Syntax: trGUI.Treenode:=<value>
Example: trGUI.rectcolor:=23
| Treenode | Label | Type | Default | Description |
|---|---|---|---|---|
| rectcolor | Color | Input int | 21 | Specify the color of the rectangle which is attached to the graph. With this rectangle, you can select an area on the graph to apply the rise time/fall time analysis. For the choice of the color, see the list of colors. |
| tool | Tool | Input int | 0 | Specify whether rise time or fall time should be computed. Options include:
|
| method | Method | Input int | 0 | Specify the method applied to locate the rise time/fall time span. It is unavailable when both high state level and low state level are specified manually. Options include:
|
| input | Rise Range/Fall Range | Input TreeNode | <unassigned> | Specify the high/low state level and the ratio of the high/low reference level to the step high. See more details in the Rise Range/Fall Range Subtree table below. |
| output | Quantities | Input TreeNode | <unassigned> | Specify the quantities to output. See more details in the Quantities Subtree table below. |
| output_to | Output To | Input TreeNode | <unassigned> | Specify where to output the results. See more details in the Output To Subtree table below. |
| display | Display on Graph | Input TreeNode | <unassigned> | Specify the properties of the display of indicators, state levels, rise/fall time and rise/fall range on the graph. See more details in the Display on Graph Subtree table below. |
| adv | Advanced | Input TreeNode | <unassigned> | Advanced settings about the smoothing operation performed before the analysis and the parameters used in the searching method, noise level unit, and how to control results when graph scale changes. See more details in the Advanced Subtree table below. |
Specify the high/low state level and the reference levels. If Rise time is selected in the Tool drop-down list, this subtree's label is Rise Range; otherwise, the label is Fall Range.
Syntax: trGUI.input.Treenode:=<value>
Example: trGUI.input.from:=20
| Treenode | Label | Type | Default | Description |
|---|---|---|---|---|
| highVolt | High State Level | Input double | <unassigned> | Specify the high state level. If the Auto check box is checked, this value will be calculated by the specified method; otherwise, you can specify a value manually. If the Method is Largest Triangle, this variable is invisible in GUI and the value will be calculated automatically. |
| lowVolt | Low State Level | Input double | <unassigned> | Specify the low state level. If the Auto check box is checked, this value will be calculated by the specified method; otherwise, you can specify a value manually. If the Method is Largest Triangle, this variable is invisible in GUI and the value will be calculated automatically. |
| from | From (%) of Step Height | Input double | 10 | Specify a value n. Then the low reference level is at n% of the step height. |
| to | To (%) of Step Height | Input double | 90 | Specify a value m. Then the high reference level is at m% of the step height. |
Specify the quantities to output.
Syntax: trGUI.output.Treenode:=<value>
Example: trGUI.output.name:=0
| Treenode | Label | Type | Default | Description |
|---|---|---|---|---|
| name | Dataset Name(name) | Input int | 1 | Specify whether to output the name of the source dataset. Options include:
|
| VMin | Low State Level(VMin) | Input int | 1 | Specify whether to output the low state level. Options include:
|
| VMax | High State Level(VMax) | Input int | 1 | Specify whether to output the high state level. Options include:
|
| dV | Step Height(dV) | Input int | 0 | Specify whether to output the step height. Options include:
|
| VrefMin | Low Reference Level(VrefMin) | Input int | 1 | Specify whether to output the low reference level. Options include:
|
| VrefMax | High Reference Level(VrefMax) | Input int | 1 | Specify whether to output the high reference level. Options include:
|
| dVref | Rise Range(dVref)/Fall Range(dVref) | Input int | 0 | Specify whether to output the rise range/fall range. If Rise Time is selected in the Tool drop-down list, the label is Rise Range(dVref); otherwise, the label is Fall Range(dVref). Options include:
|
| T1 | Time at Low Reference Level(T1) | Input int | 1 | Specify whether to output the time at low reference level. Options include:
|
| T2 | Time at High Reference Level(T2) | Inupt int | 1 | Specify whether to output the time at high reference level. Options include:
|
| dT | Rise Time(dT)/Fall Time(dT) | Input int | 1 | Specify whether to output the rise time/fall time. If Rise Time is selected in the Tool drop-down list, the label is Rise Time(dT); otherwise, the label is Fall Time(dT). Options include:
|
| Velocity | Rise/Fall Velocity (Velocity) | Input int | 0 | Specify whether to output the rise/fall velocity, which is computed by dVref/dT based on the smoothed data. Options include:
|
| MaxVelocity | Maximum Rise/Fall Velocity (MaxVelocity) | Input int | 0 | Specify whether to output the rise/fall maximum velocity, which is maximum derivation value between T1 and T2. The maximum velocity is calculated based on the smoothed data. Options include:
|
| e1 | Noise Level Low(e1) | Input int | 0 | Specify whether to output the noise level at low level baseline region. Options include:
|
| e2 | Noise Level High(e2) | Input int | 0 | Specify whether to output the noise level at high level baseline region. Options include:
|
Specify where to output the results.
Syntax: trGUI.output_to.Treenode:=<value>
Example: trGUI.output_to.reslog:=1
| Treenode | Label | Type | Default | Description |
|---|---|---|---|---|
| script | Script Window | Input int | 1 | Output the results to the Script Window. Options include:
|
| reslog | Results Log | Input int | 0 | Output the results to the Results Log. Options include:
|
| appendwks | Append to Worksheet | Input int | 0 | Append the output results to a worksheet. Options include:
|
| wbkName | Result Worksheet Name | Input string | QkRiseTime | This is only available when the Append to Worksheet check box is selected. Use it to specify the name of worksheet to which the results are appended. |
Syntax: trGUI.display.Treenode:=<value>
Example: trGUI.display.risetime:=1
| Treenode | Label | Type | Default | Description |
|---|---|---|---|---|
| indicator | Indicator | Input TreeNode | <unassigned> | Specify the settings for the indicator. See more details in the Indicator table below. |
| statelevel | State Level | Input int | 1 | Specify whether to show two horizontal lines for marking the low and high state level. |
| risetime | Rise Time/Fall Time | Input int | 0 | Specify whether to show two vertical lines through two indicators for marking the rise time/fall time. If Rise Time is selected in the Tool drop-down list, the label is Rise Time; otherwise, the label is Fall Time. |
| riserange | Rise Range/Fall Range | Input int | 0 | Specify whether to show two horizontal lines through two indicators for marking rise range/fall range. If Rise Time is selected in the Tool drop-down list, the label is Rise Range; otherwise, the label is Fall Range. |
Indicator table
Syntax: trGUI.display.indicator.Treenode:=<value>
Example: trGUI.display.indicator.size:=11
| Treenode | Label | Type | Default | Description |
|---|---|---|---|---|
| size | Size | Input int | 10 | Select the indicator size in points. |
| shape | Symbol | Input int | 0 | Select a symbol for the indicator. For more information about symbol, please refer to symbol tab of Plot Details. |
| edgecolor | Edge Color | Input int | 0 | Specify the edge color of the indicator which indicates the low/high reference level. For the choice of the color, see the list of colors. |
| fillcolor | Fill Color | Input int | 1 | Specify the color to fill the indicator which indicates the low/high reference level. For the choice of the color, see the list of colors. |
Advanced setting about smoothing before performing rise or fall time analysis.
Syntax: trGUI.adv.Treenode:=<value>
Example: trGUI.adv.pts:=60
| Treenode | Label | Type | Default | Description |
|---|---|---|---|---|
| lnsearch | Low/High Level Determine | Input int | 0 | Only available when Method is set to Linear Search. Use it to specify how to find the low/high state level. Options include:
|
| pts | Smooth Points | Input int | 50 | Only available when Method is set to Linear Search. Use it to specify the number of points used in the smoothing that is performed to the whole dataset before the rise time/fall time analysis is executed. The value can be any integer between 1 and 200. |
| pts2 | Smooth Points on Rising/Falling Area | Input int | 1 | Specify the number of points used in the smoothing that is applied on the rising/falling area. The value can be any integer between 1 and 50. |
| tol | Tolerance(Percentage) | Input double | 0.03 | Specify the tolerance for level values. Any level below this will be treated as noises. Available when Method is set to Linear Search or Histogram. |
| bins | Number of Bins | Input int | 256 | Only available when Method is set to Histogram. Use it to specify the number of bins used in the histogram method. |
| onrescale | When Graph Scale Changes | Input int | 0 | Specify the operation that will perform when the graph scale changes. Options include:
|
| noiseUnit | Noise Level Unit | Input int | 0 | Specify the unit of noise level. Options include:
|
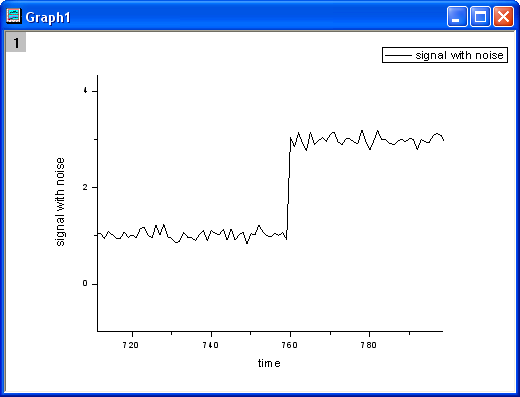
The following steps is for calculating the rise time in a step-like signal in a graph.
addtool_rise_time -d; in the command window) to open the dialog box of this X-Function.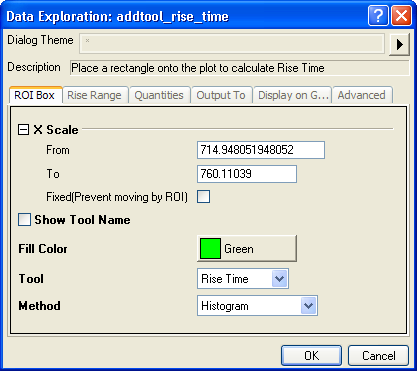
This function provides three methods for calculating rise/fall time. They are Linear Search and Histogram.
Take rise time calculation for example. The time that takes for a signal to rise from dTol1% of the step height to dTol2% of the step height (here, 0<dTol1<dTol2<100) should be computed.
Steps:
 > lowerbase + (upperbase-lowerbase)*dTol1\,")
 < lowerbase + (upperbase-lowerbase)*dTol2\,") .
. Then the region between t1 and t2 is the rise area and  .
.
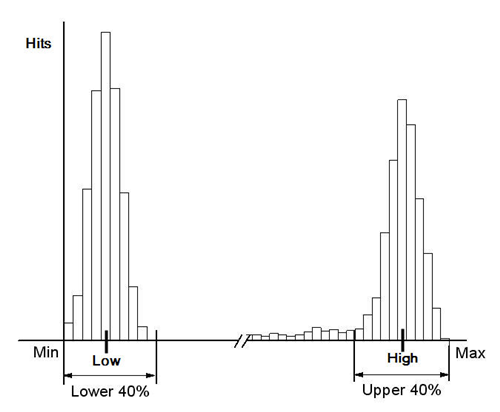
When this method is used, a state level histogram is created from the data. The limits of this histogram are set by the minimum and maximum values in the dataset and the number of bins is 256 by default. Then the number of data samples that fall into each bin is counted. The following picture is an example of the histogram. From this graph, the mean value of a bin ("Low" bin in the graph) with the maximum number of hits in the lower 40% bins is calculated as the low state level. Same calculation to a bin ("High" bin in the graph) in the upper 40% is used to calculate the high state level.
After locating the low state level and high state level by histogram, step 3 in the Linear Search method is used calculate the rise time or fall time.
As illustrated in the below picture, a line that passes through start point and end point is constructed. This line is called the base line. Then points which are on the upper-left of the base line are searched. If the triangle constructed by the point and the base line has the largest area, the vertical ordinate of this point will be regarded the value of the high state level. Similar search is performed to the points on the lower-right of the base line to find the value of the low state level.
After locating the low state level and high state level, step 3 in the Linear Search method is used to calculate the rise time or fall time.
Keywords:slope, ROI