To open the Grubbs' test dialog box from the menu:
See Also:
| Results Log Output |
Select to output results to the Results Log. |
|---|---|
| Recalculate |
Controls recalculation of analysis results:
For more information, see: Recalculating Analysis Results |
| Input |
Must be a column or column range. For help with range controls, see: Specifying Your Input Data |
| Significance Level |
Option list:
|
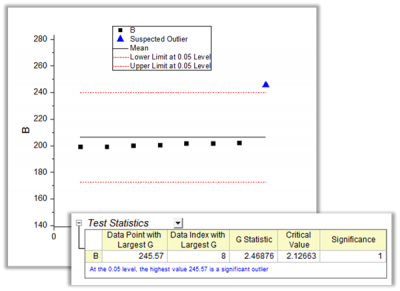
| Outlier Plot |
Select to generate an outlier plot. Scatter plot with upper and lower confidence limits and dataset mean as line plots. |
| Grubbs Plot Data |
Worksheet range to output the outlier plot data (available if Outlier Plot is selected). Flat sheet lists upper and lower confidence values. For help with the range controls, see: Output Results |
| Grubbs Report |
The worksheet range to output the report table. |
1. Calculation of the Grubbs test statistic  :
:

where  is the value of suspected point (usually highest or lowest observation),
  is the mean value of data set, and
  is the standard deviation.
Compare with the critical value.
2. Calculation of the p value:
Z^{2}}{\left ( N-1 \right )^2-NZ^2}}")
where  is the largest and
  is the number of samples.
The p value is then calculated as the two-tailed P value for the student-t distribution of the  value.
The missing values in the data range will be excluded in the analysis
Stephen L R. Ellison, Vicki J. Barwick and Trevor J Duguid. Farrant. 2009. Practical Statistics for the Analytical Scientist. The Royal Society of Chemistry, Cambridge, UK.