Spiral Bar Chart plots time-based data as bars along an Archimedean spiral. It begins at the center of a spiral and then progresses outwards.
Select one X with one Y column. The X column is mostly Time/Date data, plotted as a spiral axis; and the Y column is plotted as bars based on the spiral axis.
Select required data.
From the menu, choose .
SpiralBar.OTPU (installed to the Origin program folder).
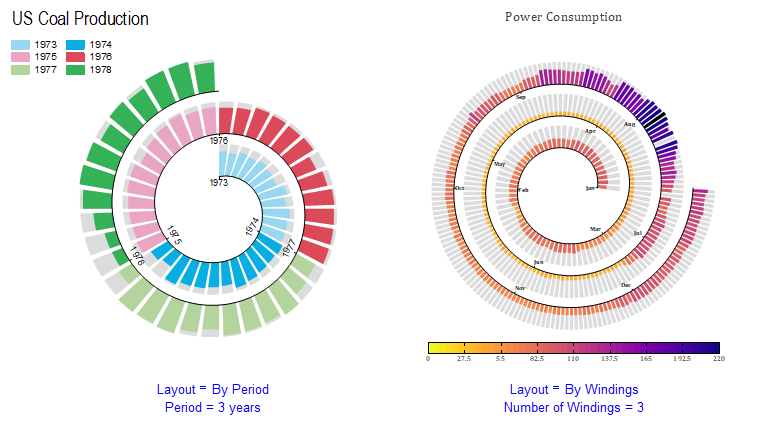
Spiral Bar Charts are ideal for showing large data sets, usually to show trends over a large time period.
To plot all these data points, you can decide which layout should be used to arrange the points:
You can go to the Spiral tab of Plot Details dialog to do further customizations.