Select at least 4 Y columns. Use one column label row or number of columns to decide the grouping. Each floating bar start from the first column and ends at the last column within group.
Select required data.
From the menu, select .
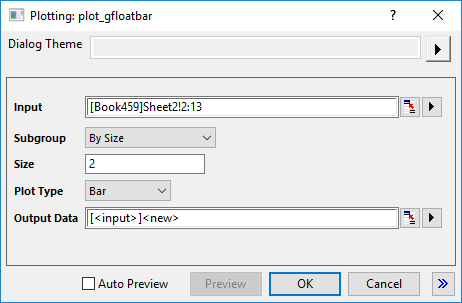
In the dialog that opens, plot_gfloatbar, select the group range and group theme to create the grouped floating bar graph.
gFloatBar.otpu ; gFloatCol.otpu (installed to the EXE folder of Origin)
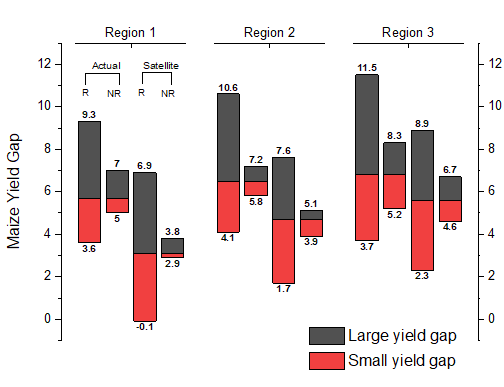
This graph type is an advanced version of Floating Bar chart, plotted from raw data(not indexed data) with grouping mechanism just like Grouped Box Charts-Raw Data.
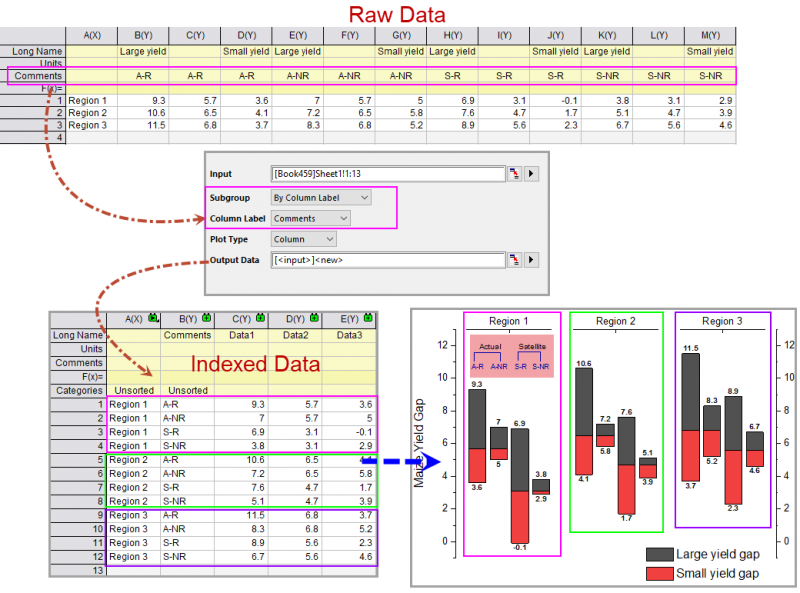
As you can see in this flow chart of plotting a grouped floating bar chart from raw data, the Subgroup setting in plot_gfloatbar dialog, is used to decide the values stacked in same bar(such all cells "A-R" in same row will be stacked together); and you can use the Subset settings in the Spacing tab of Plot Details dialog to set subsets within X axis(such as Region1. Region2 and Region3 in this example).