| Graph Arrangement
|
Specify how to arrange the statistical graphs.
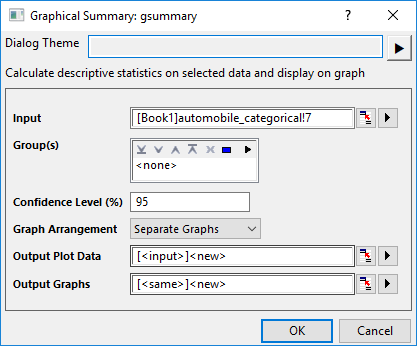
- Separate Graphs: Each variable for each group will be plotted into a separate graph. Each graph includes a histogram with distribution curve, a confidence intervals plot and a probability plot, with three result tables "Description Statistics", "##% Confidence Intervals" and "Normality Test". The graph title shows the variable and group information.
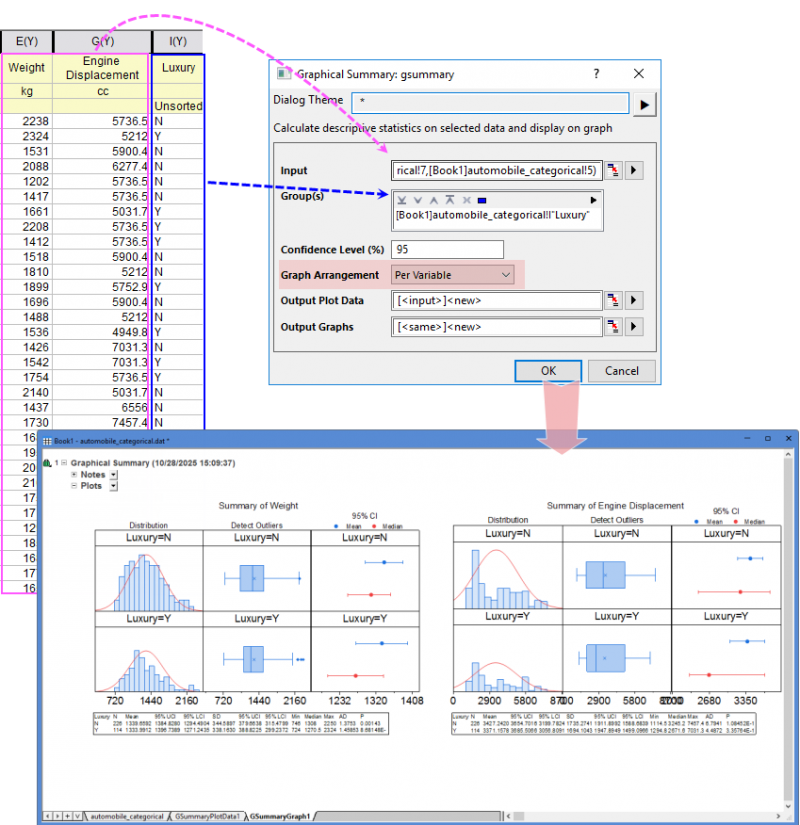
- Per Variable: Each Variable will be plotted into a separate graph. The groups will be plotted into different veritical panels. Each graph includes histograms with distribution curve, box charts with outliers, confidence intervals plots, and a table summarizing the results by row, showing statistics for each group.
- Per Group: Each group will be plotted into a separate graph. The variables will be plotted into different veritical panels. Each graph includes histograms with distribution curve, box charts with outliers, confidence intervals plots, and a table summarizing the results by row, showing statistics for each variable.
- All in One:All variables and all groups will be plotted into one graph. Each subset(Group*Variable) will be plotted into different veritical panels. This graph includes histograms with distribution curve, box charts with outliers, confidence intervals plots, and a table summarizing the results by row, showing statistics for each subset.
|