Select at least two Y columns of values (or a range from at least two columns). If there is an associated X column, X column supplies X values; otherwise, sampling interval of the Y column or row number is used.
Select required data.
From the menu, select .
or
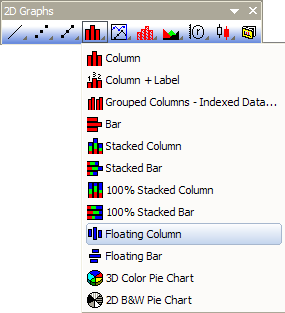
Click the Floating Column button on the 2D Graphs toolbar.
FLOATCOL.OTP (installed to the Origin program folder).
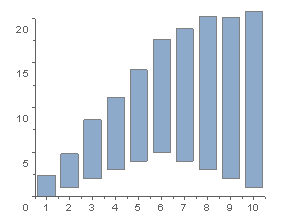
The floating column graph displays Y values as beginning, at one or more intermediate (optional), and ending column levels for each X value.
The first Y data set provides the starting Y position for each column graph. The second Y data set provides an intermediate level and defines a column between the starting position and the current position. The third (fourth, etc.) Y data set provides an additional intermediate value and defines a column between the previous intermediate value and the current value. The final Y data set provides an ending value and defines a column between the previous intermediate value and the current value.