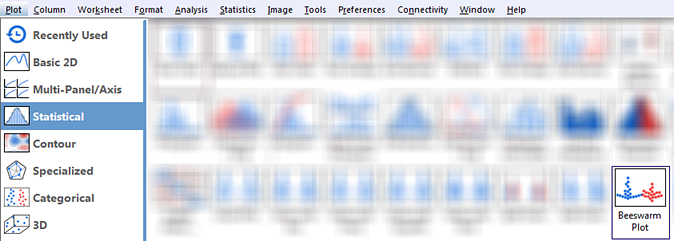
From the menu, select Plot > Statistical: Beeswarm Plot.
Template
Beeswarm.OTPU (installed to the Origin program folder)
Notes
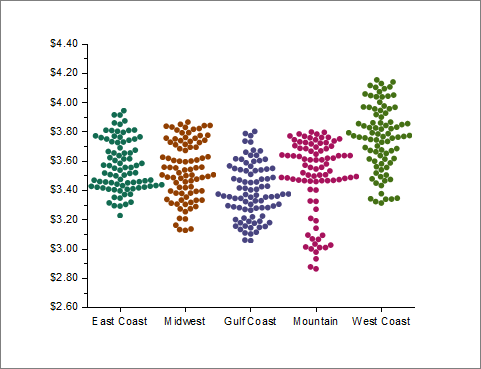
Each Y column of data is represented as a separate swarm of data points. Column Long Names, if they exist, supply the X axis tick labels, otherwise Short Names are used.