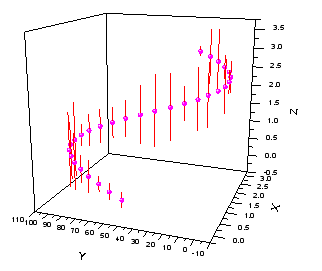
29.17.2 3D Scatter with Z Error Bar Graph
3D-ErrBars
Data Requirements
- Worksheet: Select 4 worksheet columns designated as XYZZ
or
- Matrix: You need to have two matrix objects in the same matrixsheet. The matrix object that contains the scatter data should be active.
Creating the Graph
Activate the matrixsheet or select required data from worksheet
From the menu, for worksheet data, choose ; for matrix data, choose .
or
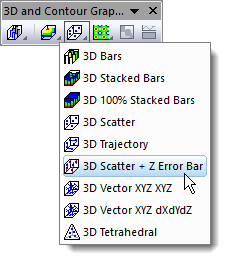
Click the 3D Scatter + Z Error Bar button on the 3D and Contour Graphs toolbar.
Template
Worksheet
- gl3DERROR.OTPU (OpenGL)
- 3DERROR.OTPU
Matrix
- gl3DSCATTERMATERR.OTPU (OpenGL)
- 3DSCATTERMATERR.OTPU
(Installed to the Origin program folder).
Notes
- If you want to add Z error bars to an existing 3D scatter graph, you can open the Error Bar tab of Plot Details to set the Z error dataset.
- If you want to plot the X error and Y error onto the 3D scatter, you can
- organize the data columns as X, XErr, Y, YErr and Z, then highlight them all to select Plot > 3D :3D Scatterto plot a 3D scatter plot with X and Y Error. Of course, you can add X and Y error bars to an existing 3D scatter graph in the Error Bar tab of Plot Details.