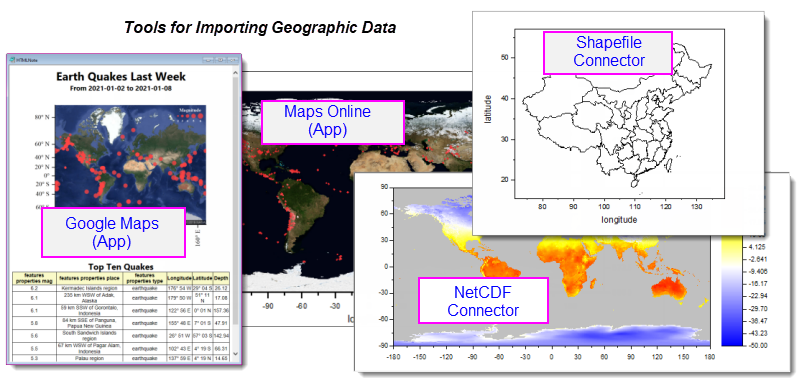
There are several ways to import geographic data into Origin. If you work with NetCDF files, Origin's NetCDF Connector is a good place to start. There is also a Shapefile Connector for direct import of shapefile data.
Additionally, OriginLab makes available, two cost-free Apps that allow you to download map data to use as a base map for scatter plots, bubble-charts and the like.
OriginLab added significant support for import and analysis of NetCDF files to Origin 2021b.
Additional Resources:
Additional Resources:
Origin's Maps Online App is a free add-on available from the OriginLab File Exchange; or by opening the App Center (F10) and searching on "maps".
This is an older App but it remains useful for adding a base map image to an Origin graph window. Users can then overlay a scatter plot, bubble plot or other plot type, on the base map.
Additional Resources:
Origin's Google Map Import App is another free add-on available from the OriginLab File Exchange; or by opening the App Center (F10) and searching on "maps".
Like Maps Online, this App predates the more powerful NetCDF and Shapefile import Connectors but, it is another way to easily add a base map to an Origin graph window. This App uses the popular Google Maps database, allowing you to reliably add consistent-looking base maps for any place on earth. As with Maps Online, the user can then overlay scatter plots, bubble maps, etc.
Additional Resources:
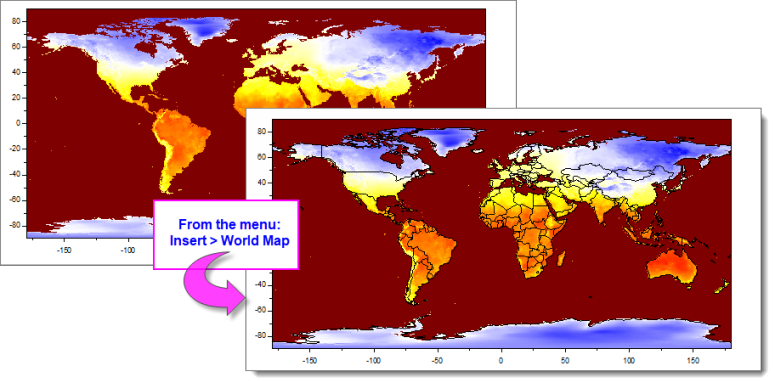
There are several ways you can add map outlines to your graphs:
When the following conditions are met, you can insert map boundaries to your Contour or Image Plot:
Additional Resources:
In Origin 2022b, inserting map boundaries simultaneously added (1) a visible "Map Data" folder to the root project folder and (2) a line plot legend entry for the boundaries (e.g. "World"). Both were hidden for Origin 2023. Roll back to the previous behavior by setting the value of these system variables = 1 (e.g. @MDF=1).
In addition, you can access the hidden map boundary worksheet in one of two ways:
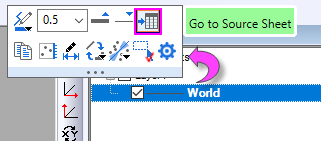
or
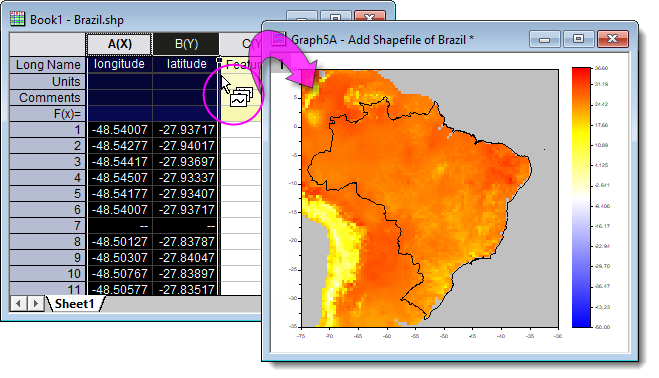
If a particular map is not available from the Insert menu, you can use the Shapefile Connector to import polygon data and add it to an existing contour or image plot.
Additional Resources:
The Import Shapefile App predates the Shapefile Connector and would not be recommended at all but for the fact that it works with another free Origin App -- Colormap for Map Data -- to add a colormap to shapefile polygons (as of version 2021b, the Shapefile Connector does not work with the Colormap App).
Additional Resources