17.1.4 Statistics on Whole Sheet
Statistics-on-Whole-Sheet
Introduction
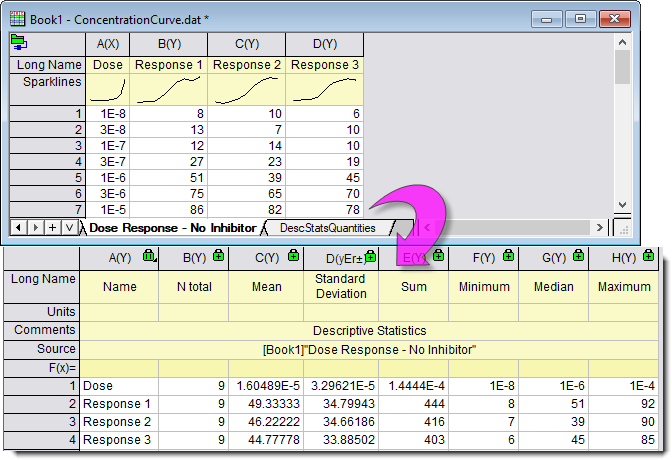
Origin provides a simple and quick tool to perform descriptive statistics on all columns in the input worksheet and generate a summary result sheet. Basic descriptors such as number of samples, sum, mean, SD, Max and Min, are calculated.
For more descriptors such as the mean score, quantiles, grouping and weight, please use Statistics on Columns.
Handling Missing Values
Missing values in the data range will be excluded in analysis.
Performing Statistics on Whole Sheet
To calculate descriptive statistics on whole sheet:
- Select Statistics: Descriptive Statistics: Statistics on Whole Sheet. This opens the Statistics on Whole Sheet dialog box.
- Specify the worksheet to be analyzed in Input Worksheet and select descriptive statistics to calculate in the Quantities list box.
- Optionally, specify one or more items in the Dataset Identifier list box to identify the source columns in the summary report sheet.
- Upon clicking OK, a report table sheet DescStatsQuantities is created to show the specified statistics of all columns in the sheet.
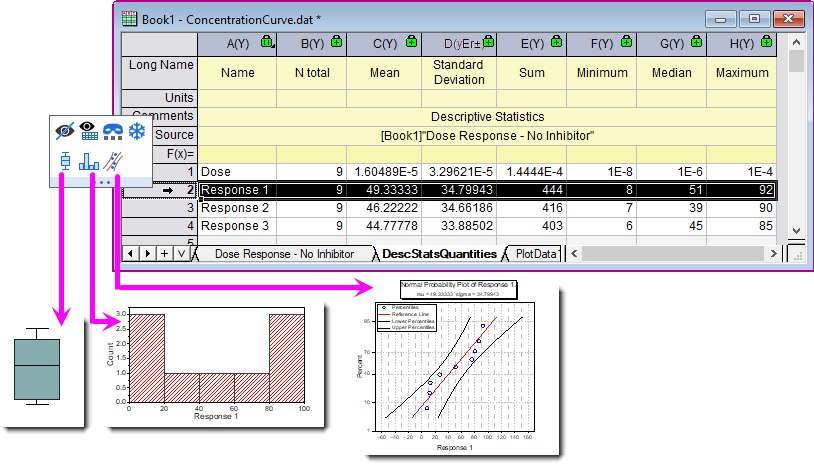
Create Statistical Plots
You can plot box chart, histogram and probability plot from the report sheet DescStatsQuantities directly.
- Highlight one row in worksheet DescStatsQuantities, a mini toolbar appears.
- Select desired button in the second line to plot graphs from the source dataset.
- Click
 button to plot a box chart from the source dataset. For example, in the below image, if you select 2nd row to plot, it will use col("Response 1") in the source worksheet Dose Response - No Inhibitor to create a box chart.
- Click
 button to plot a histogram from the source dataset. For example, selecting 2nd row will use col("Response 1") in the source worksheet Dose Response - No Inhibitor to plot a histogram.
- Click
 button to plot a probability plot from the source dataset. For example, selecting 2nd row will use col("Response 1") in the source worksheet Dose Response - No Inhibitor to create a P-P plot.
 | The locked result flat worksheet DescStatsQuantities output from Statistics on Whole Worksheet can be sorted by highlighting the reference sorting column and right click to select Sort Worksheet.
|
|
Topics covered in this section:
|