17.1.11 Distribution Fit (Pro Only)
Distribution-Fit
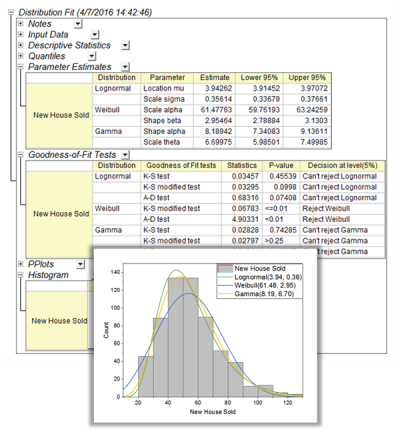
Distribution fit is to fit a parametric distribution to data. It helps user to examine the distribution of their data, and estimate parameters for the distribution.
Processing Procedure
Choose Distribution/Model
Discrete Data or Continuous Data
Judge whether your data are continuous or discrete and select from the Distribution Type radio box. If your data contains floating point numbers, then it must be from continuous distribution. If your data are all integers, you can choose either continuous or discrete distributions.
Choose a Proper Model
Look at nature of your data, the statistical values such as mean, standard deviation, skewness .etc and statistical graph such as histogram, CDF plot to decide which distribution is proper for your data. You can also choose multiple models if you are not sure the exact model
Choose Results for Output
Descriptive Statistics
- Quantiles:
- The quantiles will be output to the Quantiles table, which reveals how the variable distributes. It includes values of minimum, 1st quartile(Q1), Median, 3rd quartile(Q3), maximum, interquartile range (Q3 - Q1), range (maximum - minimum)
- Moments and More Moments:
- The basic statistics will be output to the Descriptive Statistics table, it includes values of mean, standard deviation(SD), SE of mean, lower/upper 95% CI of mean, and selected values in the More Moments branch.
Plots
- Box Chart:
- Box chart is a graphical representation of key values from summary statistics.
- Histogram:
- Histograms shows properties of your data such as skewness, behavior in the tails, presence of multi-modal behavior, and data outliers. Histogram with PDF curves overlay can be compared to the shapes of PDF curves of different distributions, helping you visually identify an underlying distribution.
- Cumulative Distribution Function Plot:
- The Cumulative Distribution Function (CDF) plot is useful to actually determine how well the distributions fit to data.
- Probability Plot:
- The probability plot is used to test whether a dataset follows a given distribution. It shows a graph with an observed cumulative percentage on the X axis and an expected cumulative percentage on the Y axis. If all the scatter points are close to the reference line, we can say that the dataset follows the given distribution.
| Notes: If you want to compare the different variables, please select Arrange Plots of Same Type in One Graph check box. It will arrange the variables to be plotted in one graph for comparison. Please note that in the graph histogram will be stacked and with same bin size.
|
Goodness of Fit
- Kolmogorov-Smirnov:
- Popular test method, simple and intuitive.
- Kolmogorov-Smirnov (Modified):
- Modified Kolmogorov-Smirnov method, provided by D’Agostino and Stephens (1986). Has higher statistical power than the Kolmogorov-Smirnov (KS) test,
- Anderson-Darling:
- Gives more weight to the tails than the Kolmogorov-Smirnov test.More powerful than K-S test if data with outliers
Test Mean or Variance
We can further test whether the mean of data or variance is equal to a specified values using the Basic Tests branch.
If standard deviation is known, choose z-test, otherwise choose t-test for Mean Test
|
Topics covered in this section:
|