17.1.6 Cross Tabulation and Chi-square (Pro Only)
crosstab
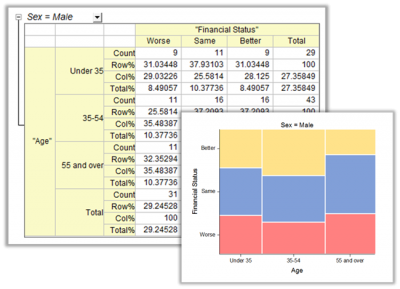
Cross tabulation and Chi-square (also known as contingency table) is a table to reveal the frequency distribution of the variables. Analysis based on the table can determine whether there is a significant relationship, obtain the strength and direction of the relationship, and measure and test the agreement of matched-pairs data. It is widely used to analysis categorical data.
Goals
There are four main goals for cross tabulation:
- Frequency analysis
- To display the frequency distribution of the variables in a table format, calculating counts, percentage or even residual for each cell.
- Test of independence
- To determine whether there is a significant relationship between variables in the contingency table.
- Measuring association
- To assess the strength and direction of the relationship between the variables in the contingency table.
- Measuring agreement
- To test or measure to what degree two different rater or two different systems of evaluation are in agreement. For example, it can be used to consider how consistent that the the survey takers give their choice. such as agreeing or disagreeing with a statement
Processing Procedure
Preparing Analysis Data
Cross tabulation and Chi-square analysis can be performed on the raw data or frequency data.
- Raw data
- There is a column for each variable and each row represents an observation.
- Frequency data
- There is a column for each variable and a column of frequencies. Each row represents a level in the group.The column of frequencies represents the numbers of observations of the level in the data.
- For example
| Sex
|
Frequencies
|
| Female
|
15
|
| Male
|
21
|
Selecting Marginal and Cell Statistics For Contingency Table
Counts
- Counts
- The observed frequency for each cell
- Expected Counts
- The observed frequency for each cell under the assumption that the column and row variable are independent
Percentages
- Percentages of Row Counts (Row%)
- Percent of each cell count to its row total
- Percentages of Column Counts (Col%)
- Percent of each cell count to its column total
- Percentages of Total Counts (Total%)
- Percent of each cell count and margin total to the grand total
Residuals
Origin provides three kind of residuals, Usually the more the value is close to zero, the more likely the column and row variable has no association. Please view interpreting results page for more information
- Residuals
- The difference between the observed count and the expected count.
- Standardized Residuals
- Also called Pearson residual.It standardizes the residuals by dividing by the square root of the expected count.
- Adjusted Residuals
- It is further standardized by taking into account of overall size of the sample. The most useful residual for comparing residual between different cells.
Selecting Methods for Test of Independence
Origin provides two different methods to test whether there is significant relationship between variables in the contingency table.
- Chi-Square tests
- A commonly used test for hypothesis that the row and column variables are independent.
- Fisher's Exact test
- Fisher's exact test is available only for a 2*2 table. It is particularly useful when sample sizes are small (even zero in some cells) and the Chi-square test is not appropriate.
Selecting Methods for Measuring Association
Measures for Nominal Variables
Chi-Square Based Measurements
- Phi
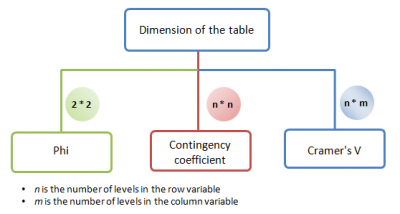
- Phi is a statistic which adjusts the chi-square by taking account of the sample size. Usually it is used for comparing 2*2 tables.
- Contingency coefficient
- Contingency coefficient is another statistic which adjusts the chi-square by the sample size. Similar to Phi, it also not recommended for comparing between tables of different dimension. But when the tables have the same dimension(same n and same m while n,m>2), it is useful. Comparing to Phi, it is kind of standardized statistic so that user can comparing with the statistic with 1 to measure the association between variables when n > 2 and m > 2
- Cramer's V
- A statistic which adjusts the chi-square by both the sample size and the dimension of table(n*m). It is commonly used for comparing the association between tables which have different dimensions.
PRE Measurements
- Lambda
- The most commonly used measurement for proportional reduction in error(PRE), which is by what percentage do we reduce our error when using the independent variable to predict the dependent variable. If the dependent variable is not predictable by the independent variable (Lamda = 0), it is more likely that the the two variable has no association.
- Uncertainty Coefficient
- Another measure measurement for PRE. But it is more conservative than Lambda
Measures for Ordinal Variables
- Gamma
- Classic statistic for ordinal variables. No correction for ties
- Kendall's tau-b and tau-c
- The most commonly used statistics for ordinal variable. It is similar to Gamma but corrected for ties. Kendall's tau-b is used for n*n table while tau-c can be used for n*m table.
- Somer's D
- Differ from Gamma and Kendall's tau-b and tau-b, Somer's D is an asymmetric statistic. It is appropriate when you want to identify which variable is depend on another. For example, it is useful to detect whether there is association between scores in examination (1,2,3,4,5) and the studying time out of school per week (5~10hr, 10~15hr ect...). The score in examination is the dependent variable and studying time out of school per week is the independent variable
Selecting Methods for Measuring Agreement
- Kappa
- Kappa is also known as Cohen's Kappa. It is to test whether two rater are agree with each other and to what degree two raters are in agreement when they are call up to evaluate the same object.
- Bowker's Test
- Also called the McNemar-Bowker test of symmetry. It is known as McNemar test for 2*2 table and Bowker's test for n*n table. It measures the agreement of matched-pairs data that each observation in one rater matches the observation of the other. For example, it tests whether the proportion of normal patient rater 1 evaluates is equal to the proportion of normal patients rater 2 evaluate when they evaluate the same group of patients.
Selecting Other Measures
- Odds Ratio
- It is available only for a 2*2 table. Odds Ratio measures the ratio of the odds that an event or result will occur to the odds of the event not happening.
- Relative Risk
- It is available only for a 2*2 table.Relative Risk measures the ratio of the odds of an event occurring in an group to the odds of the event occurring in a comparison group.
- Cochran-Mantel-Haenszel
- Cochran-Mantel-Haenszel tests are used to assess whether there is any relationship between the row and column variable after controlling for the layer variable. They consist of two type of tests( Conditional Independence Test, Odds Ratios’ Homogeneity Tests) and an estimator of Common Odds Radio.
Performing Cross Tabulation and Chi-square
- Select Statistics: descriptive statistics: Cross Tabulation and Chi-square
- Or
- Type crosstab -d in script window.
| This section covers the following topics:
|