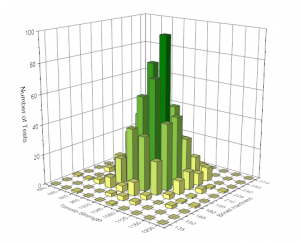
The twoDBinning tool bins data having two variables (two dimensions). When this function is applied to data saved in two columns, a matrix with the counts in two dimensions will be created. If needed, a 3D bar graph, contour or an image plot of the result can be generated to help visualize the distribution of data points.
The missing values in the X/Y data will be excluded in the analysis
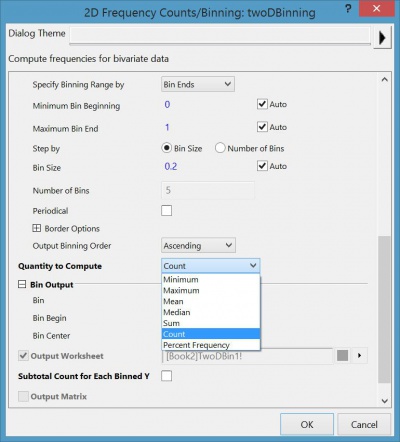
To perform 2D binning:
When you run this procedure, Origin creates a set of bins in the X-Y plane, starting at the minimum X and Y values, by increment size. Origin records the number of XY pairs that fall within each bin and creates a matrix with output data. Coordinates of the output matrix consist of the extreme values and each cell displays the number of "hits" observed for each bin.
Other quantities can be generated by 2D Binning. E.g. you can also get other statistics info. such as mean, max, min, etc. of data that fall within each bin. |
|
Topics covered in this section: |