In this lesson we will learn about flexible ways of selecting data for plotting.
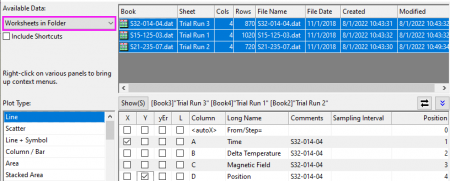
![]() | To pick up worksheets from anywhere in your project, set the drop down to Worksheets in Project. |
![]() | This dialog has a third bottom panel which can be used to assign data to different layers in a multi-layer graph. If that panel is open, you can simply collapse it and then click OK to create the graph. |
![]() | You also can double-click on the white space of the layer to open the Plot Details dialog with the Layer1 node been selected on the left panel. Then go to the Size tab on the right side. Check the Link Axis Length to Scale with X:Y Ratio box and keep the ratio as 1. |
![]() | You can add a map to a graph using the Maps Online App. This blog post is a good place to start. |