5.2 LabTalk Language Fundamentals
Tutorial-Language-Fundamental
Summary
LabTalk supports variables of data types, statements and control structures. Some common to other programming languages while some are unique in Origin to easily perform tasks related to Origin's worksheet, graph, plot, etc. Using these variables with different statements is the basic idea of scripting in Origin.
What You Will Learn
This tutorial will show these fundamentals with various examples:
- Define and use types of data types and variables
- Run different statements
- Commands
- control structures
- Run LabTalk functions including build user-defined LabTalk function
- Read and set object properties and methods
- Run X-Function
- Define and use Macro
- Build OriginC Function and Use it in LabTalk Script
LabTalk supports nine data types: double, integer, constant, dataset, string, stringarray, range, tree and graphic objects. A variable used without a declaration is by default type double or string -- if it ends with $, it's a string variable, otherwise, it's a double variable
Scope of Variables
There are 3 scopes of variable: Session, project and local and it's determined by declaration.
- Variables created without declaration (only allowed for types double, string, and dataset) become Project variables and are saved with the Origin Project file.
- Declared variables become Session or Local variables. Session variables will be available as long as Origin isn't closed.
- Variables declared in a { } block are local variables and have a scope which is destroyed when leaving a block.
- Define some project variables - use without declaration
aa = 3; //double variable since not declared
str$ = "Hello"; //string variable ends with $
- Define session variables - declare and then use
double bb = 1.234;  //declare and assign
double cc; //declare
cc = 9.876; //assign
int nn; //declare
//You must assign a value when declaring a constant
//And the constant value cannot be changed.
const c1 = 0.5; //declare and assign
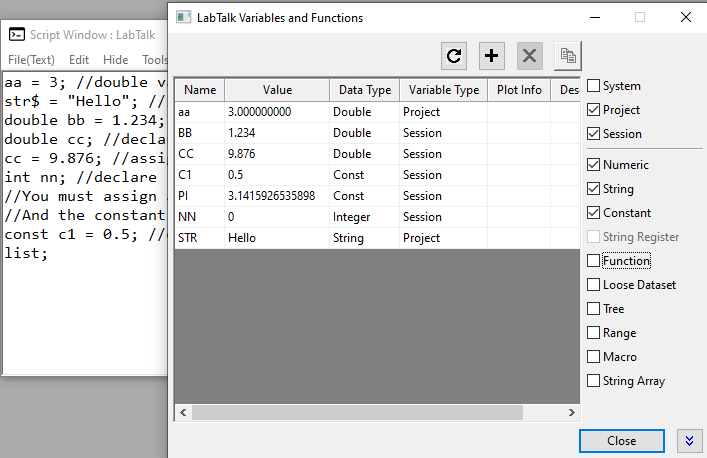
- Run the list command to open a LabTalk Variable Viewer to view, edit, add, and delete variables and their scopes.
list;
 | You can use the list and delete command with options to view and delete variables.
|
- Choose File: Save Project As to save the project as LT.opju
- Start a new project.
- Check project variables. They are not recognized.
aa=; //output Undefined variable: AA
str$=; //output #Command Error!
- Check session variables. They will output values since in same Origin session.
bb=; //output bb=1.234
cc=; //output cc=9.876
nn=; //output nn=0
c1=; //output c1=0.5
- Close Origin and retart Origin (new session)
- Check all variables. Since new session and project isn't loaded, all the variables are not recognized.
aa=;
str$=;
bb=;
cc=;
nn=;
c1=;
- Open LT.opju and check all variables. Only project variables are recognized.
aa=; //output aa=3
str$=; //output Hello
bb=;
cc=;
nn=;
c1=;
String Register was the only way to save strings before string variable was supported in Origin. We recommend using string variable though string register is still supported. Please note that some string registers are reserved for Origin use e.g. %H for current window name, %Y for User Files folder, etc.. Please use the unreserved string registers if you want to use it to save strings.
- Assign string to string register
%A="Hello World";
%A=;
- Define a string variable and then store it in a string register.
string greeting$ = "Good Morning";
%B = greeting$;
greeting$ =;
%B =;
- Concatenate string register and string variables
%J="%A, " + greeting$;
%J=;
- Normally, % plus any letter is interpreted as one of 26 string registers. By prefixing a % symbol you can stop the substitution
//Define a string variable with the text "%B" without recognizing it as a string register
string str1$ = %%B;
str1$ =; //should output %B
Dataset type data is loose dataset not associated with any worksheet. They can be used in calculations and be assigned to worksheet columns. Project level dataset can be used for plotting while session level dataset can't be used for plotting.
- Create a project-level loose dataset by assignment
//define loose dataset
temp = {10,9,8,7,6};

//output values
temp[1]=; //output 1st value 10
type $(temp); //output all values separated by space

//using dataset to do calculation
temp2=sqrt(temp); //square root of temp

//Use plotxy X-Function to plot line+symbol graph, temp as X, temp2 as Y
plotxy iy:=(temp, temp2) plot:=202;

//assign loose dataset to worksheet columns
col(A)=temp;
col(B)=temp2;
- Besides define loose dataset by assignment, user can also create project level loose dataset by create command.
//Create a XY loose dataset "tmpdata" and define row number as 5
create tmpdata -wdn 5 X Y;
Note: As demonstrated in previous lessons that command can take options. Some options can also take arguments. E.g. The create command takes argument tmpdata and -wdn option. The -wdn option also takes argument 5 X Y so tmpdata_X and tempdata_Y dataset are created with size of 5.
- Pass numeric values to tmpdata_X one by one.
tmpdata_X[1] = .1;
tmpdata_X[2] = .2;
tmpdata_X[3] = .25;
tmpdata_X[4] = .4;
tmpdata_X[5] = .5;
- Pass the values into dataset tmpdata_Y by existing dataset.
tmpdata_Y = temp;
- Plot tempData as line+symbol graph:
//plotXY is an X-Function
plotxy iy:=tmpdata_Y plot:=202;
- Assign new values to dataset. Plot will update accordingly.
tmpdata_X=data(0.1,0.5, 0.1); //assign 0.1, 0.2, ... 0.5 to tmpdata_X
tmpdata_Y=sort(normal(5)*10); //generate 5 random values and sort them, then assign to tmpdata_Y
- If declared, the dataset will be a session level variable.
//create a session variable aa with numbers 1-10with increment of 0.5
dataset aa = {1:0.5:10}; //declare and assign
Inside your Origin Project, data exists in four primary places: in worksheet, in matrix, in a loose dataset, or in a graph. Range data type provides a consistent way to access them.
The syntax is
- [Workbook]Sheet!Column
- [Matrixbook]Matrixsheet!MatrixObject
- [Graph]layer!Plot
- [??]!LooseDatasetName
Range variable can also refer to window, sheet, layer, subrange of data or a block of data across multiple columns or even sheets. This tutorial will only show some basic examples. You can learn more about it in the next Range Notation in LabTalk Tutorial.
- Define range variable and refer to column A on Sheet1 of Book1 window
range rA = [Book1]Sheet1!Col(A);
rA.=; //dump all properties
rA.(); //dump all methods
rA.lname$=; //output long name
rA.nRows=; //output number of rows
rA.unit$="MM/DD/YYYY"; //set unit as "MM/DD/YYYY"
ra.setformat(4);//set column as Date
- Define range variable for columns on multiple sheets and do calculation
// Point to column 1 of sheets 1, 2, and 3 of the active workbook:
//for active book, [bookname] part can be skipped
range aa = 1!col(1);
range bb = 2!col(1);
range cc = 3!col(1);
cc = aa+bb; //column contents will be updated
- The following example uses the plotxy X-Function to plot a graph, and then the smooth X-Function to smooth a subrange of the data.
newbook;
fname$ = system.path.program$ + "\Samples\Signal Processing\EMG Recording.dat";
impasc;

// Define two range variables for subranges of imported data
//rxy1 specifies subrange with X value from 5 to 5.5
//rxy2 specifies subrange with X value from 9.3 to 9.8
range rxy1 = (1, 2)[x5:5.5];
range rxy2 = 2[x9.3:9.8]; //if X info not mentioned, it will use the associated X column for Y
plotxy rxy1 plot:=200;  // Plot line for the 1st XY subrange
smooth -r 2 rxy2 method:=le;  // Smooth the 2nd XY subrange by Loess method
The smooth result is put to rows 10601 -11601 in column C, the corresponding X in 1st column is from 9.3 to 9.8.
- Define range variable for sheet. Then define range variable for column on the sheet
range rwks = sheet1!; //sheet1
rwks.addcol(); //add a column.
range rC=rwks!C; //column C
rC=data(5,10, 0.5);
- Define a string array and add string members to it.
StringArray stra;
stra.Add("Hello");
stra.Add("World");
stra.getAt(1)$=; //output Hello
stra.getAt(2)$=; //output World
- Use the following script (a loop structure, which will be further introduced in the section below) to print out the strings in string array stra.
loop(ii,1,stra.GetSize())
{
  string str$=stra.GetAt(ii)$;
  str$=;
//It should return
//Hello
//World
}
Tree
LabTalk supports the standard tree data type, which emulates a tree structure with a set of branches and leaves (both are called nodes). The branches contain leaves, and the leaves contain data.
- Define a tree variable and add branches and leaves
tree report;
// Tree nodes are added automatically during assignment:
//report two has 2 branches, each branche has two leaves
report.user.name$="Tom"; //string
report.user.age=22; // number
report.=; //output the tree contents
The tree data type is often used in X-Function's tree type argument, no matter it's input or output.
- Get tree type output;
//use impasc X-Function to import data
string str$ = system.path.program$ + "Samples\Graphing\Group.dat";
impasc fname:=str$
//Get import information
impinfo trInfo:=fileInfo; //impinfo. X-function has a tree output trInfo, assign it to a tree variable
fileinfo.info.filename$=; //output imported filename
fileInfo.=; //output all contents of the tree
System variables are used to monitor or control Origin behavior.
E.g. the @ASC system variable to check and change the number of megabytes needed to trigger auto save checking.
//Run the following script line to get the variable value
@ASC = ;
//Run the following script line to set the variable value to be 10 (MB)
@ASC = 10;
Statements
Quick Output Statement
Use = to output the left hand side (LHS) expression, variable, string register, object property, function, system variable info.
There are already many examples of using = to output variable values in previous section.
Below will show examples of There are already many examples of output variable, string register and object properties in above section. Here are some examples output calculation results
10+3*5=; //output 10+3*5=25

aa=8.1;
aa+sqrt(aa)=; //output aa+sqrt(aa)=10.946049894152

col(A)[1]-mean(col(A)=; //calculation using col() and mean() functions

range ra=A;
ra[0]-min(ra)=; //calculation expression using range variable

dataset ds={5.6, 3.4, 2.1, 0.5};
total(ds)=; //output total(ds)=11.6 //calculation using total() function and dataset variable

//note: sum(ds) will return a dataset with cumulative sums {5.6, 9.0, 11.1, 11.6}
sum(ds)=; //will return 5.6, 1st value in cumulative sum
sum(ds)[0]=; //will return 11.6, last value in cumulative sum
Expression (RHS, right-hand side) is evaluated and put into LHS (left-hand side). If LHS does not exist, it is created if possible, otherwise an error will be reported.
Assign value to variable and output values
//assign
double min = 0.5;
string filename$="sensor01.dat";
dataset ds={0.1, 0.2, 0.3};
range ra=[book1]sheet1!A; //range variable for column A in specified book and sheet
ra=data(800, 1000, 10); //fill it with 800 to 1000 with increment of 10

//output
min =; //output 0.5
filename$=; //output sensor01.dat
ds[1]=; //output 0.1, 1st value of ds
ra[2]=; //output 900, 2nd value in column A
Note: For dataset and range variable, need to use e.g. type $(ds); type $(ra); to output all values
Read and write object properties
wks.name$=; //output current sheet name. For string property, use $ at the end
wks.name$="Data"; //set
wks.ncols= ; //output number of columns in current sheet;
wks.ncols=10; //set number of columns to 10
wks.=; //list all wks object properties
Col(A)[1]=; //return first value in column 1
Col(A)[0]=; //return last value in column 1
wks.col1.=; //list all wks.col1 (1st column) object properties
LabTalk command statements are similar to DOS batch commands in form of
command -option argument(s);
- Depending on the command, the option and argument may be optional.
- Options are always preceded by the dash "-" character.
- Arguments are either a script or a data object.
- For some commands, options can also take their own arguments.
- The type command takes option (-n) and and argument (string to output)
//Display string in a dialog box with Yes and No buttons
type -n "Do you want to continue?";
- The repeat command takes two arguments the number of times to execute, and script to repeat
//Prints "Hello World" in a dialog box three times.
repeat 3 {type -b "Hello World"}
- The create command takes argument tmpdata and -wdn option. The -wdn option also takes its own arguments 10 X Y so tmpdata_X and tempdata_Y dataset are created with size of 10.
create tmpdata -wdn 10 X Y;
tmpdata_X=normal(10);
tmpdata_Y=tmpdata_X-mean(tmpdata_X);
type $(tmpdata_X, .2);
type $(tmpdata_Y, .2);
Control Structures
LabTalk supports 3 control structures and they can be nested inside another.
- the sequence structure - statement are executed one after the other in the order in in which they are written.
- the selection structure - selection statements/decision making statement to perform action based on condition. E.g. if, if-else, switch, break, continue.
- the iteration structure - looping statement to perform statements repeatedly as long as condition remains true. E.g. for, loop, repeat and doc -e to loop through Origin objects, such as books, graphs, sheets, etc.
Decision Making Statements
In an Origin project file, make sure there is one workbook, one graph window one matrix window and one Layout page. Activate them and run the following script one by one to determine window type by exist() function
<lt>
if(exist(%H)==3)
      type -b "A graph window is active";
else
      if(exist(%H)==2)
            type -b "A worksheet is active";
      else
            type -b "Neither a graph nor worksheet is active";
The switch command is used when more than two possibilities are needed in a script.
For example the script above with the if-else structure can be modified as below:
switch(exist(%H))
{
    case 3:
       type -b "A graph window is active";
       break;
    case 2:
       type -b "A worksheet is active";
       break;
    case 5:
       type -b "A Matrix is active";
       break;
    default:
       type -b "Neither a graph, worksheet nor matrix is active";
       break;
}
Loop Control Statements
Loop control allows the program to repetitively perform a set of actions as long as conditions are met. LabTalk provides four loop commands: for, repeat, loop, doc -e.
The for loop is similar to C.
- The syntax is for (expression1; expression2; expression3) {script}
In this syntax, expression1 specifies the initialization, expression2 is evaluated to determine whether to execute the script(if true) or to terminate the loop (if false), expression3 is executed at the end of each loop, it is often the increment of a counter. Both expression1 and expression3 can consist of multiple statements separated by commas as in
for(ii = 1, jj = 9; ii <= 5 ; ii++, jj++)
{
ty $(ii), $(jj), $(ii+jj);
}
Execute the following for loop to output every 10th value in the loose dataset loopdata.
dataset loopdata=normal(50);
for(jj = 1; jj <= loopdata.GetSize(); jj = jj + 10)
{
  loopdata[$(jj)] =;
}
The following shows using for loop to set columns as XYXY... and their long names
wks.ncols=10;
for (ii=1; ii<=wks.ncols; ii++)
{
   if (mod(ii,2)==1)
   {
       wks.col$(ii).type=4;
       wks.col$(ii).lname$="Time";
   }
   else
   {
      wks.col$(ii).lname$="Amplitude";
   }
}
The repeat loop is used when a set of actions must be repeated without any alterations.
- The syntax is: repeat numberOfTimes {script}
//create 6 new workbooks
repeat 6 { newbook;}
The loop is used when a single variable is being incremented by 1 with each successive loop.
- The syntax is: loop (variable, startVal, endVal) {script}
//Create a loose dataset (50 rows) which is not associated with a worksheet
create loopdata -t 50;
//Pass values into the dataset with a loop
loop(ii, 1, 50)
{
  loopdata[$(ii)] = ii^2;
}

//dump loopdata values
type $(loopdata);
The doc -e loop is used loop through Origin objects (window, sheet, etc.) and execute script.
doc is the abbreviation for document. Remember for LabTalk commands, the command can be shorted as long as it's unique.
- The syntax is: doc -e object {script}
The following script loops through all graph windows and set legend background to shadow and refresh the graph
doc -e LP
{
  legend.background=2; //set legend background to shadow
  doc -uw; //refresh window
}
The following script output the name of each dataset in the Origin project (including worksheet columns and project-level loose datasets).
doc -e S
{
  %C =;
}
Origin provides many built-in LabTalk functions to work with different types of data and object in Origin, such as string, math, statistics, date and time, data generation, lookup, logic, etc. User can also define LabTalk functions and call them in Script.
The syntax to call LabTalk Functions
FunctionName(Arg1 Arg2 ... ArgN);
Supported argument and return types:string, double, int, dataset and tree. Functions can be used in expressions and usually show on right hand side of assignment statement. But some functions can show on left hand side of assignement.
Use the Left( ) function to process strings
//Define a string variable and assign "Hello World" to it
string str1$ = "Hello World";
//Use 'Left' function to get the left 5 characters the string
string strLeft$ = Left(str1$,5)$;
strLeft$ = ; //should return Hello
Some functions can appear on the left side of an assignment, e.g. Col() function
//Fill column A with data() function
col(A) = data(600,850,10); //data() function creates a dataset from 600 to 850 in steps of 10
Use mean(), min() and max() functions to calculate mean, min and max of column and output them by type command.
for (ii=1; ii<=wks.ncols; ii++)
{
   type "Col $(ii): Mean -- $(mean(wcol(ii)), .2), Min -- $(min(wcol(ii)),.2), Max -- $(max(wcol(ii)),.2)";
}
User-Defined LabTalk Function
Create user-defined functions with the syntax below:
function dataType funcName(Arg1 Arg2 ... ArgN) {script;}
- First declare a user-defined numeric function by calling built-in functions. This function will generate a Julian date value from a random numeric value.
function double JDate(double num)
{
   //Calculate an integral from the double number
   int x = int(exp(num)*1000);
   //Generate the day, month and year integral with remainder function mod()
   int iDay = mod(x, 27) + 1;
   int iMonth = mod(x, 11) + 1;
   int iYear = 2013 - mod(x, 5);
   //Define a string as MM/DD/YYYY
   string jd$ = $(iMonth)/$(iDay)/$(iYear);
   //Return the Julian date number from the string as the function result
   //The string will be substituted with %() notation
   return date(%(jd$));
}
- Call the user-defined function JDate to calculate a Julian date from a numeric value, e.g. 0.83.
//calculate the Julian date and pass it to double variable jda
double jda = JDate(0.83);
//Output the numeric value of jda
jda =;//Should return 2455373
//Display the date with format MM/DD/YYYY
type $(jda, D0);//Should display 6/26/2010
- Create a new workbook with 2 columns, right click on the first column (column A) and choose Fill Column With:Normal Random Numbers to fill in the column with random numeric values.
Note: You can also run the following script to get the random values filled in the first column with the csetvalue x-function:
newbook;
wks.nCols = 2;
csetvalue col:=1 formula:="grnd()";
- Use the JDate function to calculate a Julian date in column B.
col(B) = JDate(col(A));
- Change the column format to Date.
wks.col2.format = 4;
There are many Origin LabTalk Object (visible or not visible) to control Origin and its elements. Object contains properties and methods (functions).
E.g. run object isn't visible in workspace. Use it to run ogs file.
- run.file(filename) to run the script before any section at the beginning of the ogs file.
- run.section(filename, sectionname) to run the specified section in ogs file
See the example in Save Script as an OGS File and Run it section in previous Getting Started tutorial.
There are also many visible objects. Each workbook and graph window contains basic elements (objects). These objects each have pre-defined names and unique properties and methods that can be controlled using LabTalk. For a complete list of Origin objects, view the Help file.
E.g. each window has page object for the window. For graph window, there is also at least one layer object.
Have a graph window active and run the following to set window long name and anti-alising on so curves look smooth on screen
page.longname$="My Chart"; //set window long name
page.aa=1; //set anti-alising on
All legend, axis title, label and graphic object also have properties and methods.
legend.SHOWFRAME=0;//Turn legend object frame off by
yl.TEXT$="Power"; //Rename left Y axis title
yl.color=4;//Set left Y axis title color to blue
| For such legend, title, label, arrow, line, rectangle, circle objects on graph, hold down Alt key and double click on an object in graph to see the object name on Programming tab. Or in newer versions, right click Graph node in Object Manager window and choose Show Graph Objects to find the name.
|
There is at least one worksheet object wks in workbook. Each worksheet has column sub-objects (coln) for each (nth) column.
Start a new worksheet and run the following to fill data, add column, set filter condition and apply the filter
//fill column A with 600 to 850 with increment of 10
col(A) = data(600,850,10);

//fill column B with with random numbers, number of data is same as col(A)
col(B) =  normal(wks.col1.nrows); // nrows of wks.col1 object

//Add a column
wks.addcol(); //addcol() method of wks object
wcol($(wks.ncols))=col(B)/col(A); //ncols property of wks object
wks.col$(wks.ncols).type=3 //set last column as YError bar

//Set filter condition in col2
wks.col2.filter$="x>0"; //filter$ property of wks.coln object

//Apply the filter so only rows with positive value in col2 will show
wks.runfilter(); //runfilter() method of wks object
Note: In above script both wks.col$(wks.ncols).type=3 and wks.col3.type=3 work but using the wks.ncols property is a better coding practice since it refers to last column. The $(wks.ncols) is a numeric substitution notation which means that the value of wks.ncols is evaluated first and then that value gets substituted before the LabTalk statement is executed.
| Use objectname.= and objectname.() will dump all all available properties and methods. E.g. to see all wks object properties and methods, run
wks.=;
wks.();
|
Most of the dialogs and functions in Origin are based on X-Functions, which are callable from LabTalk
For example, if you select the Analysis:Signal Processing:Smooth menu, a dialog will open allowing you to smooth irregular and noisy data. You can tell the dialog is built by X-Function since the dialog title shows Dialog name:X-Function name.
Not all X-Functions are associated with menu or toolbars so you may not be able to find all X-Functions from GUI. In such cases, the best approach is go to Help: Programming: X-Function and check the X-Function Reference with are organized by category.
The syntax to call X-Function is as follows,
xFunctionName [argument1:=<range,name or value> argument2:=<range,name or value> ... ][ -switch];
where the arguments and -switches may be optional depending on the X-Function.
The following script uses [newbook x-function to create a new workbook with arguments to set book name and sheet number
//The workbook will be named as Test1 (both long and short name)
//There'll be 5 worksheets in this workbook
newbook name:=Test1 sheet:=5 option:=lsname;
X-Functions have a number of input and output variables. In this case, we specified name, sheet and option. For those we skipped, default value will be used.
Some useful switch options to find info. of the x-function
newbook -h;  //dump help
newbook -hv; //dump variable list
newbook -he; //dump script example
newbook -d; //open X-Function dialog
Associate a name with given script which can later be used as a command and include arguments.
Define a simple macro and use it.
Run the following script first to define a macro named as testmacro
def testmacro
{
	repeat %1
	{
		repeat %2
		{
			type -l "=";
		}
		type;
	}
}
Use the macro
testmacro 2 64; // 2 is substituted for %1 and 64 for %2
A function properly implemented with Origin C can be called by LabTalk script.
- Open Code Builder and choose File: New...
- Choose C File and set File Name test and click OK.
- Start a new line at the bottom of the file and paste the following OC code
double CubeRoot(double x)
{
	if(x < 0)
		return -10^(log10(abs(x))/3);
	else
		return 10^(log10(x)/3);
}
- Choose Build: Rebuild All.
- In Script window, run the following script to call the CubeRoot() function.
double aa = CubeRoot(125);
aa = ;//It should return aa=5
Col(A)=data(1,100); //fill column A with 1, 2, ... 100
col(B)=aa*CubeRoot(Col(A)); //set col(B) value by function and variable