Geotiff in Origin: Import, Export, Analyze, Visualize
A GeoTIFF is a standard .tif or image file format that includes additional spatial (georeferencing) information embedded in the .tif file as tags. Starting from 2022b, you can easily handle the GeoTIFF files in Origin.
Import and Export
- Import GeoTIFF file as images
- Import DEM data from GeoTIFF file for further analysis
- Export processed image or analysis result as GeoTIFF images.
Visualize and Processing
- Extract an area of interest in a GeoTIFF by shapefile
- Apply different palettes to GeoTIFF
- Set Gray scale display range
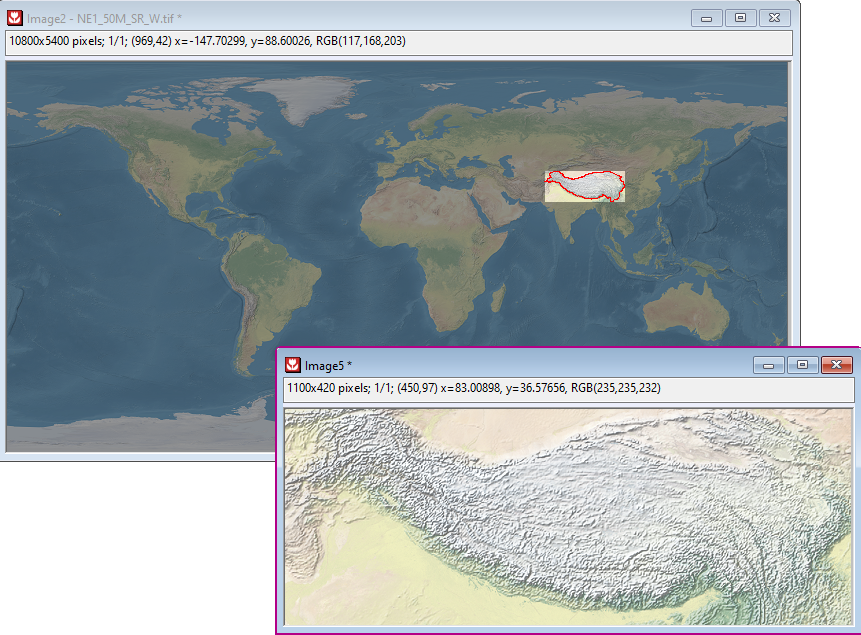
Extract a polygonal area from GeoTIFF Image by a shapfile
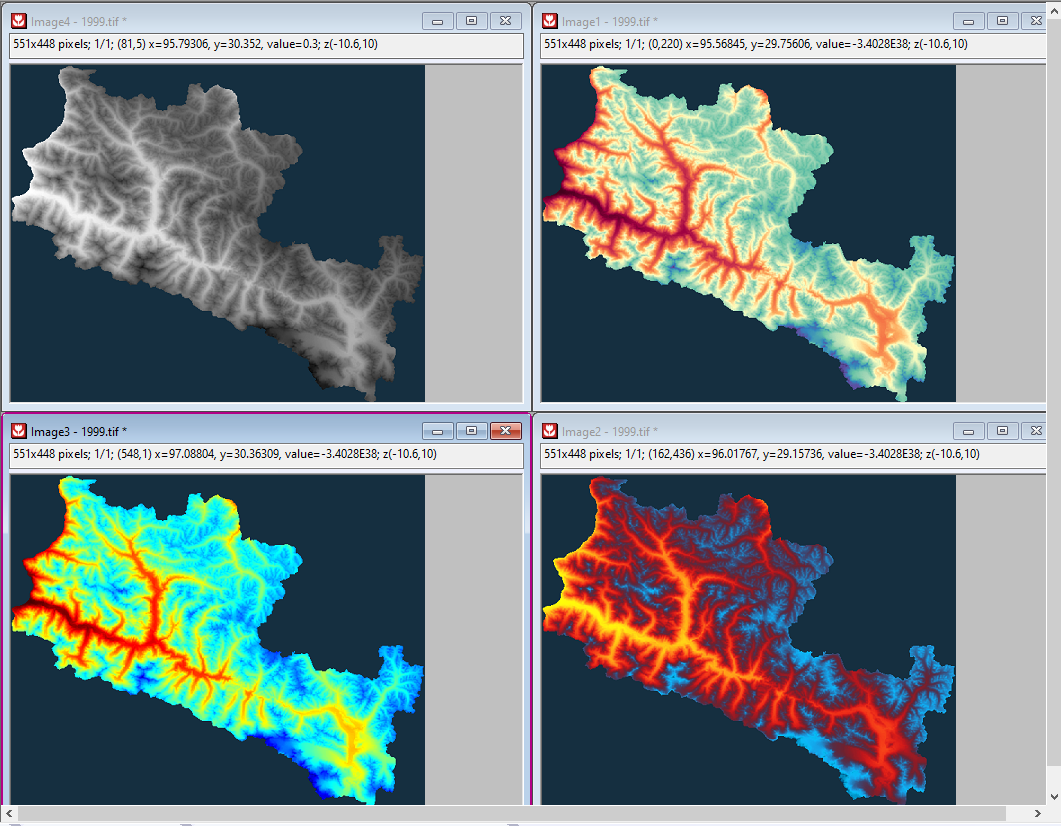
The same GeoTIFF file in different palettes

Import 25 years' GeoTIFF Image in Origin
Graphing
- Set GeoTIFF as backgound of graph (Pie map, Bar map, Bubble)
- Plot raster data as Contour, Surface, etc.
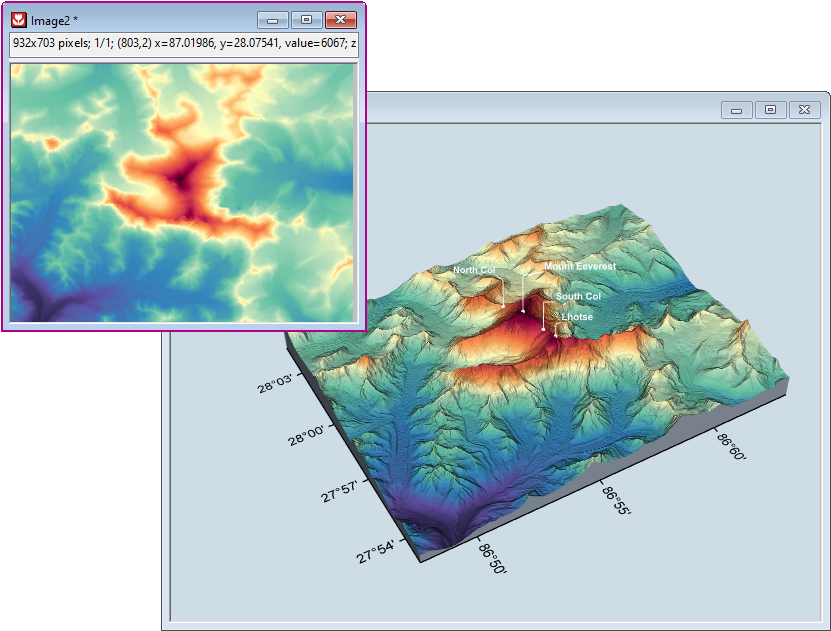
Surface plot from DEM data
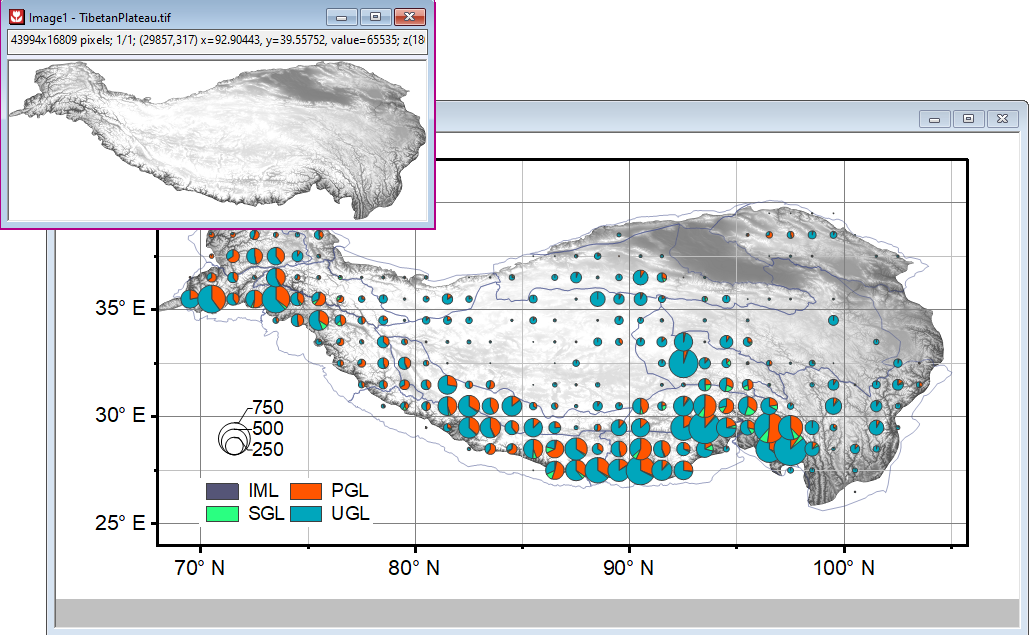
GeoTIFF image as background in graph, with pie map and shapefile overlaid
Analysis
Import GeoTIFF files as stacked matrices in Origin, analyze using Origin tools as you would NetCDF data
- Linear Fit
- Statistics
- Operation between matrices
- Pixel extraction
- Finding mean, min and max values of area of interest
- Also: See the OriginLab File Exchange for a NetCDF Data Analysis App for Sen's Slope, Mann-Kendall Test, Linear Fit, and Correlation Coefficient
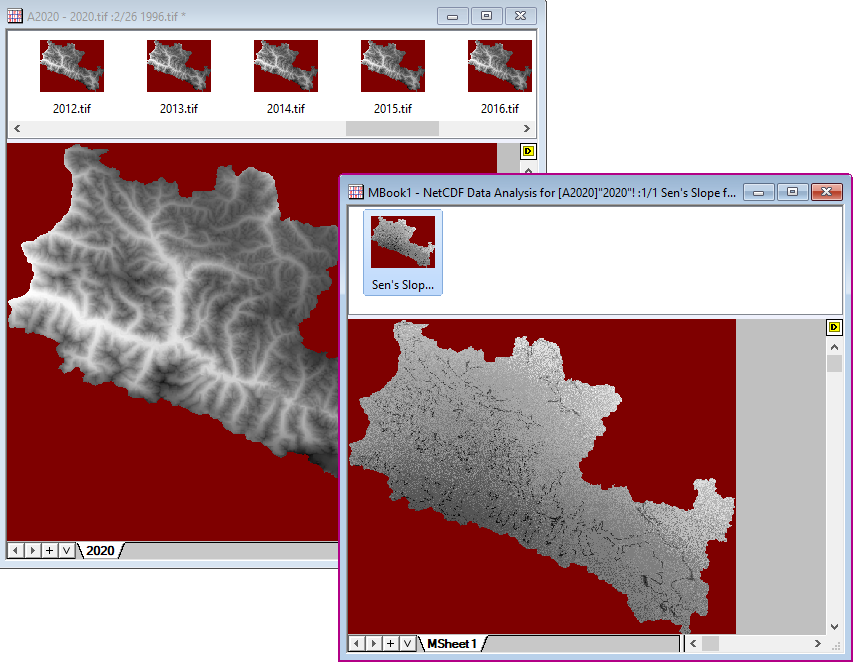
Perform Theil–Sen regression on multiple years of GeoTIFF data and get the rate of change (slope value)